> ## Documentation Index
> Fetch the complete documentation index at: https://docs.osto.one/llms.txt
> Use this file to discover all available pages before exploring further.
# SAST
> Connect your Git provider to run static analysis, dependency scanning, and secret detection across your source code.
**SAST** (under **Code Security**) secures your codebase *before it ships*. Connect a Git provider and Osto runs static analysis, software composition analysis (dependency scanning), and secret detection across your repositories — all in one place.
> **Path:** Code Security → SAST
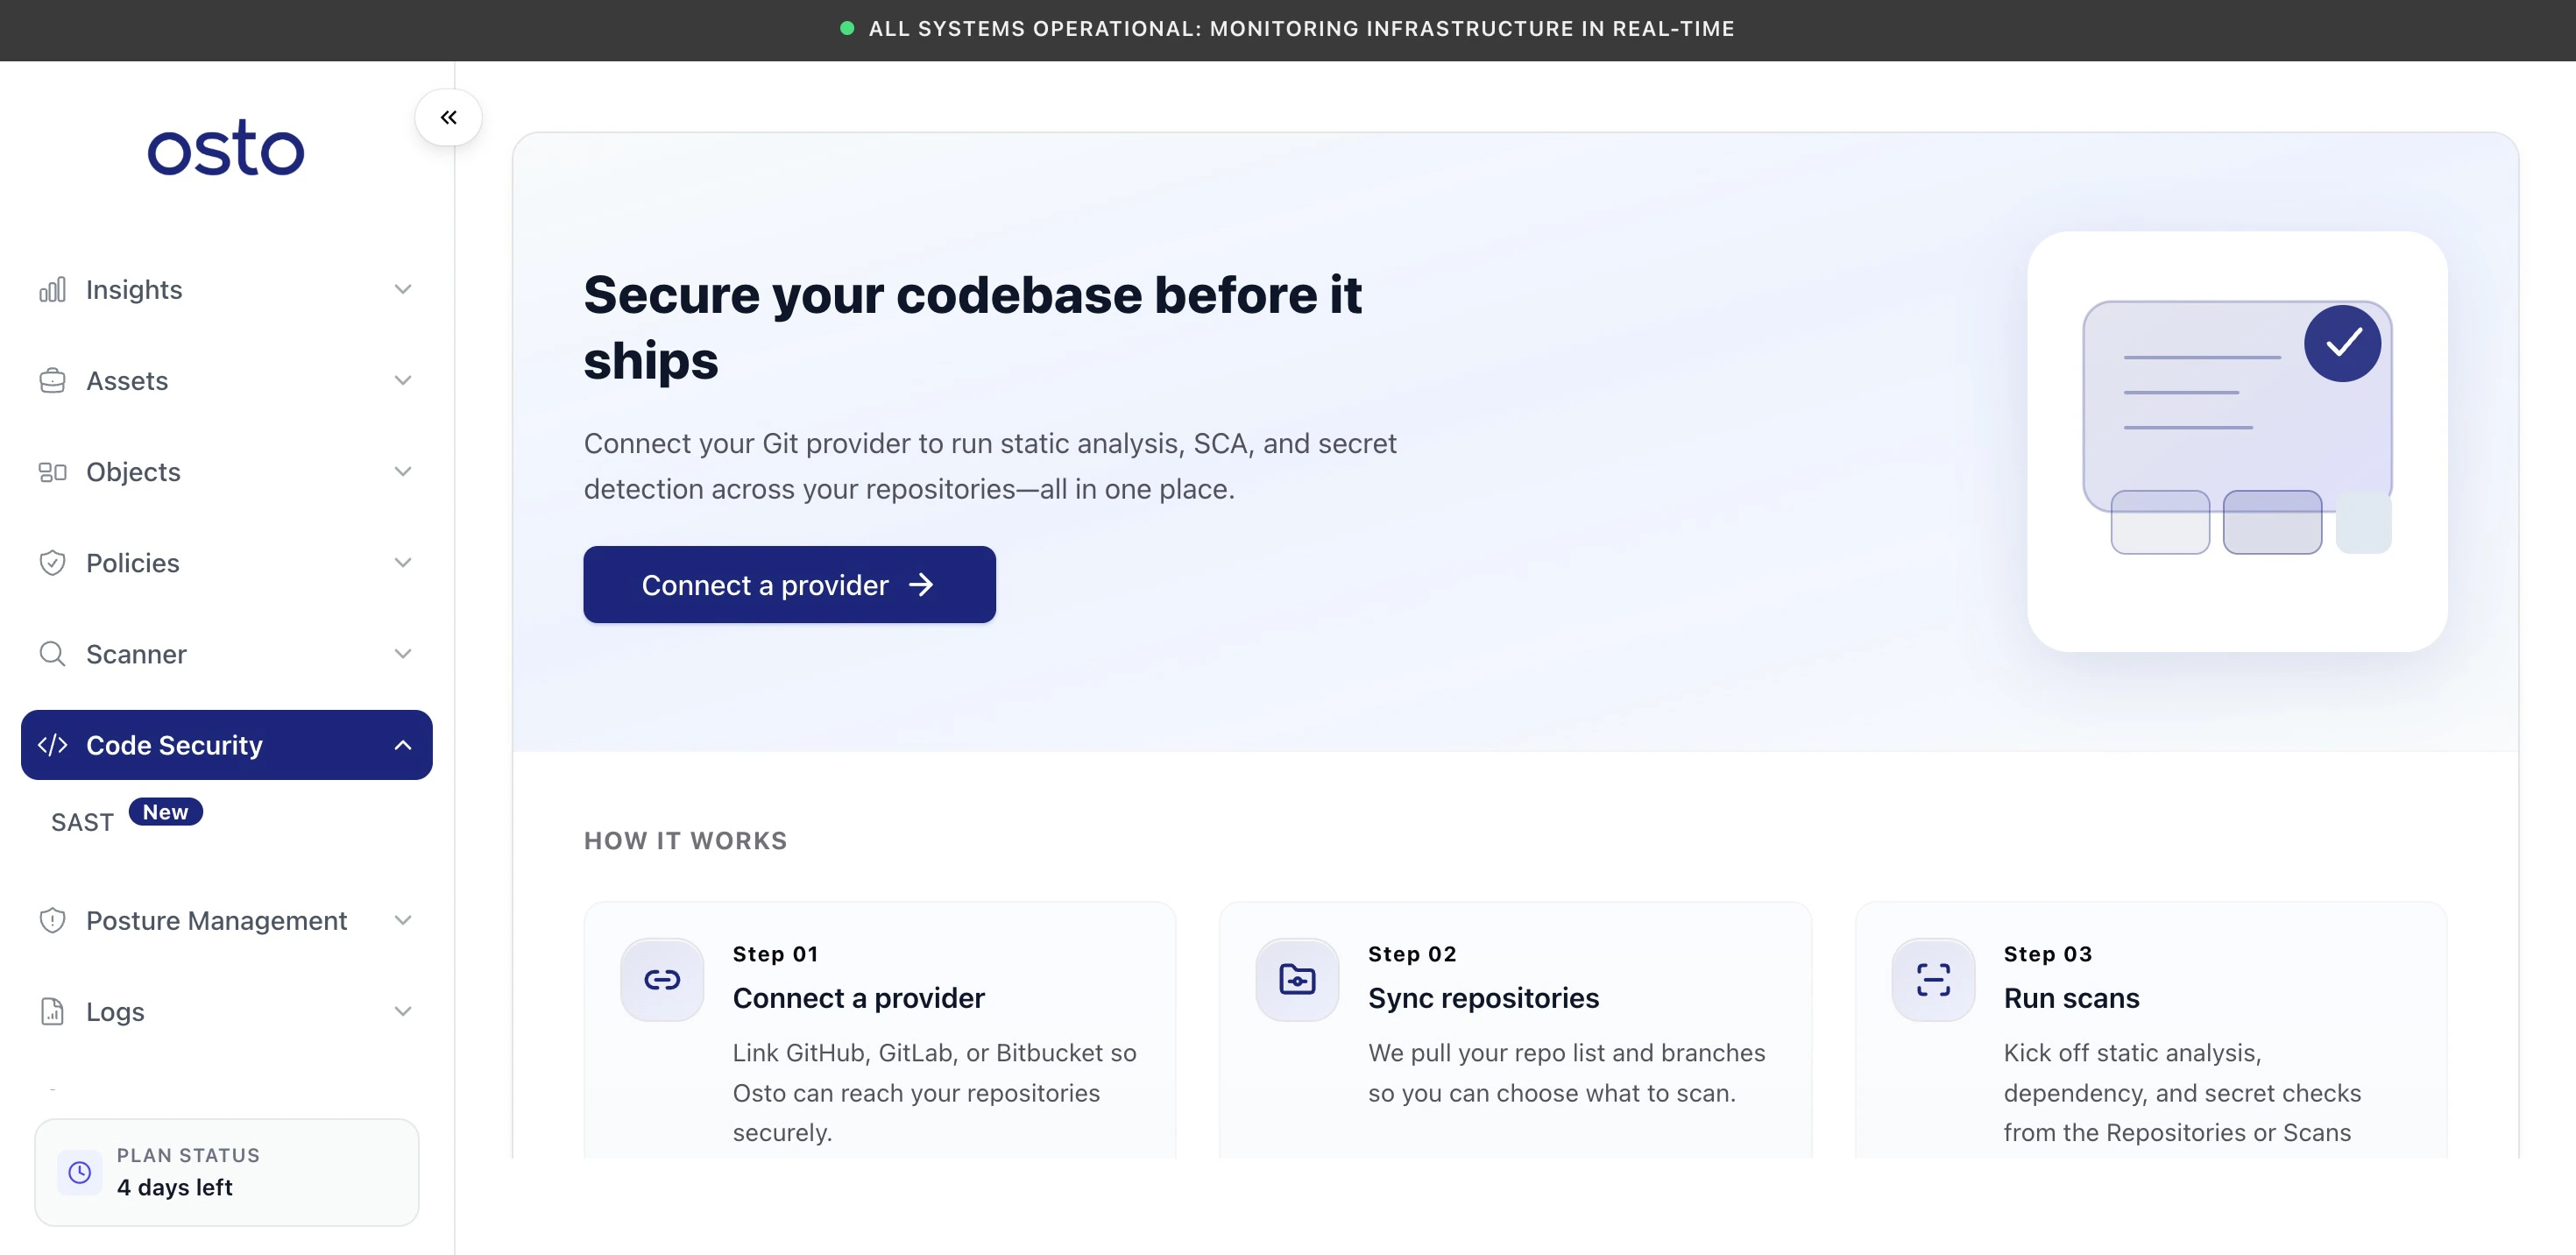 ## How it works
Getting started takes three steps:
| Step | What happens |
| ------------------------- | -------------------------------------------------------------------------------------------- |
| **1. Connect a provider** | Link GitHub, GitLab, or Bitbucket so Osto can reach your repositories securely. |
| **2. Sync repositories** | Osto pulls your repository list and branches so you can choose what to scan. |
| **3. Run scans** | Kick off static analysis, dependency, and secret checks from the Repositories or Scans tabs. |
## Connect a provider
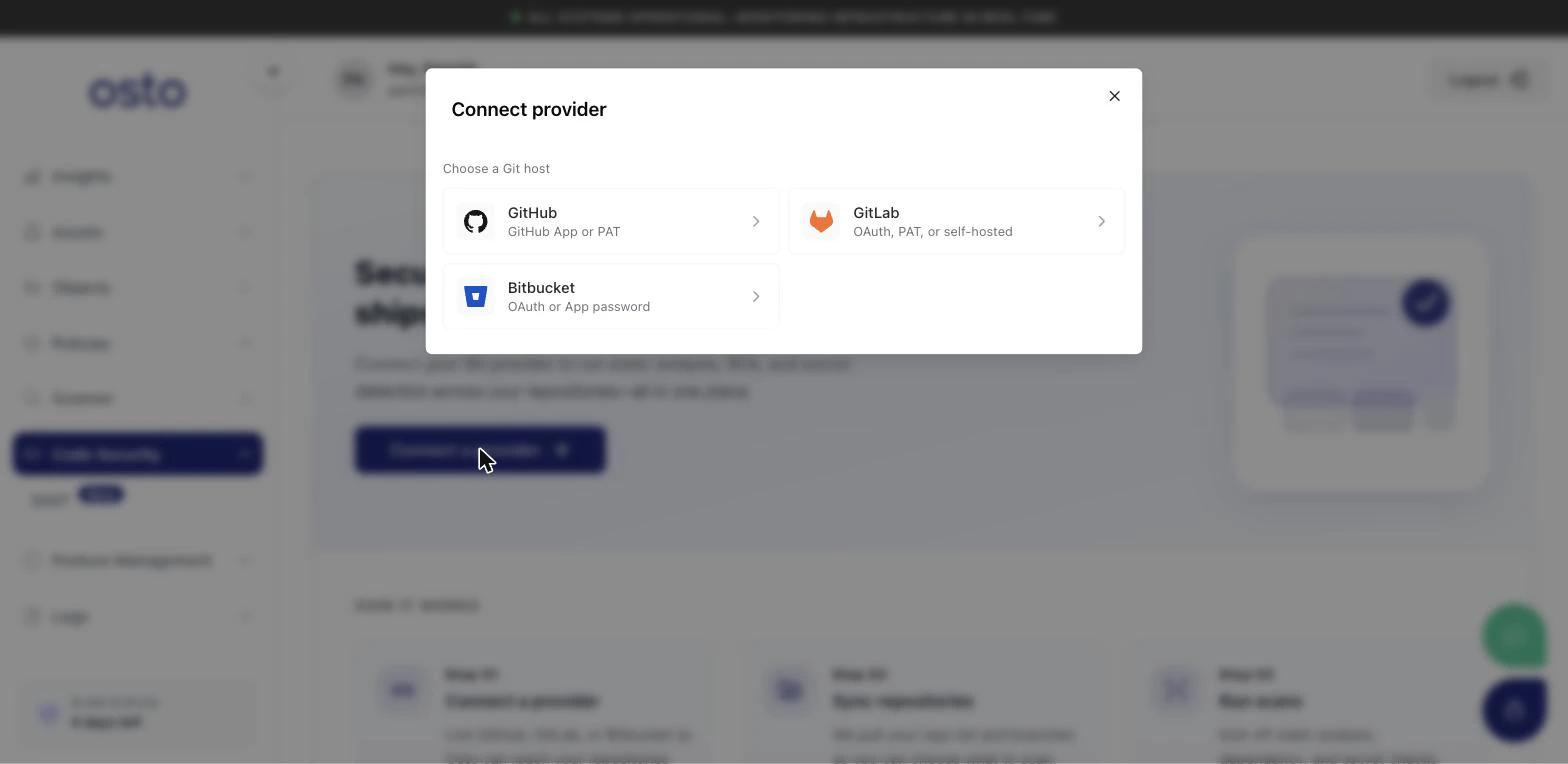
Click **Connect a provider** to open the connection dialog, then choose your Git host:
Connect with a GitHub App or a personal access token.
Connect gitlab.com or a self-hosted instance via OAuth or a token.
Connect with OAuth or an app password.
## How it works
Getting started takes three steps:
| Step | What happens |
| ------------------------- | -------------------------------------------------------------------------------------------- |
| **1. Connect a provider** | Link GitHub, GitLab, or Bitbucket so Osto can reach your repositories securely. |
| **2. Sync repositories** | Osto pulls your repository list and branches so you can choose what to scan. |
| **3. Run scans** | Kick off static analysis, dependency, and secret checks from the Repositories or Scans tabs. |
## Connect a provider
Click **Connect a provider** to open the connection dialog, then choose your Git host:
Connect with a GitHub App or a personal access token.
Connect gitlab.com or a self-hosted instance via OAuth or a token.
Connect with OAuth or an app password.
 ### Choose how to connect
After picking a host, choose a connection method:
### Choose how to connect
After picking a host, choose a connection method:
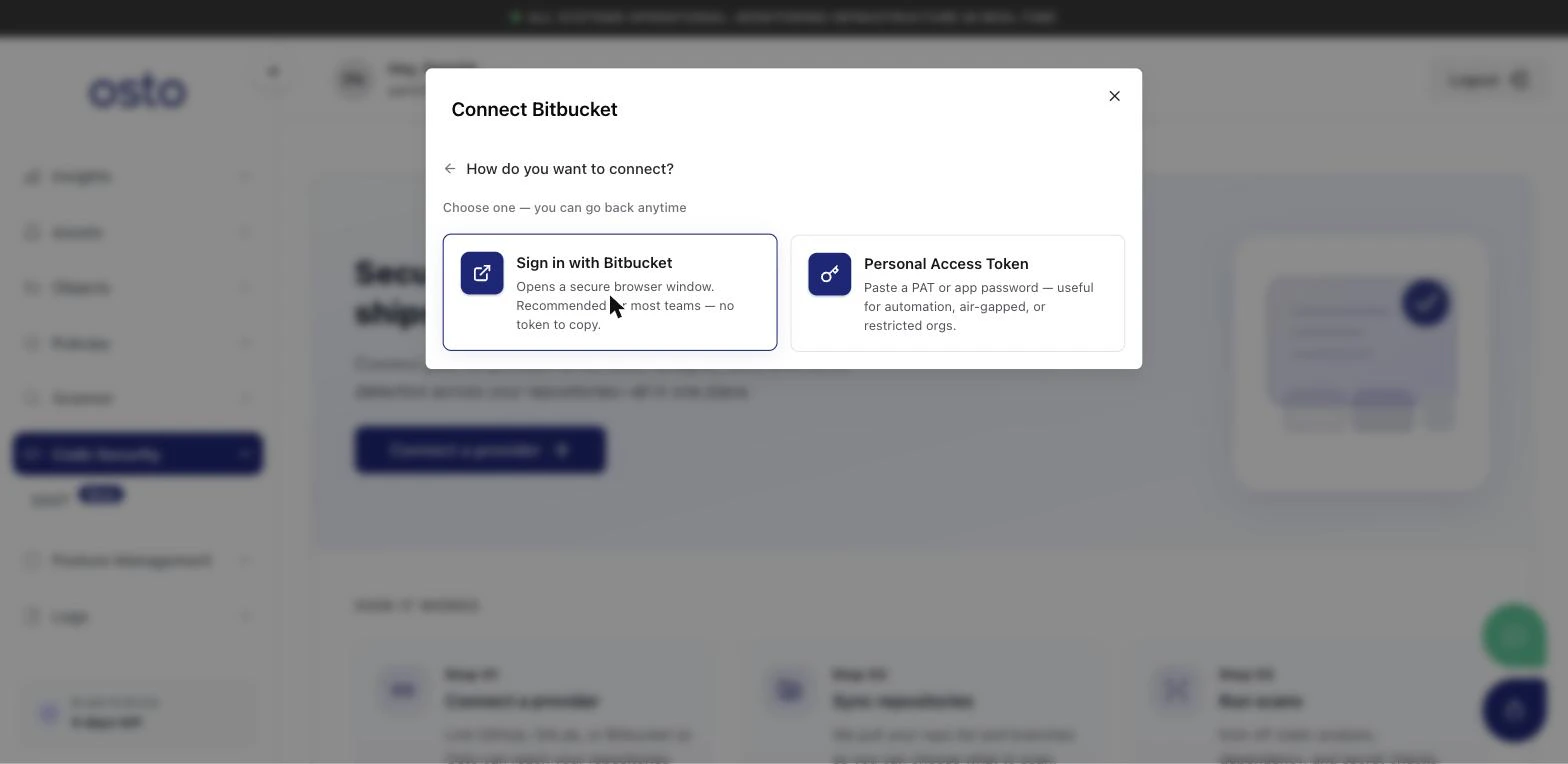 * **Sign in with the provider** — opens a secure browser window to authorize Osto. Recommended for most teams; there's no token to copy.
* **Personal Access Token** — paste a token or app password. Useful for automation, air-gapped environments, or restricted organizations. You'll give the connection a name and paste the token, then select **Add connection**.
Connecting **GitLab** adds one extra choice: **gitlab.com (cloud)** or a **self-hosted GitLab** instance (your own CE/EE URL). Self-hosted instances connect with a personal access token.
## After connecting
Once a provider is linked, SAST opens up into five tabs across the top of the page, and a top-right **Report** button is available throughout. Until a provider is connected, SAST shows the onboarding screen above.
### Integrations
Your home base once connected. The top cards summarize your **Connections**, **Repositories**, **Findings**, and **Scans**, followed by a severity breakdown of all findings (Critical / High / Medium / Low) and how many are **fixable**.
* **Sign in with the provider** — opens a secure browser window to authorize Osto. Recommended for most teams; there's no token to copy.
* **Personal Access Token** — paste a token or app password. Useful for automation, air-gapped environments, or restricted organizations. You'll give the connection a name and paste the token, then select **Add connection**.
Connecting **GitLab** adds one extra choice: **gitlab.com (cloud)** or a **self-hosted GitLab** instance (your own CE/EE URL). Self-hosted instances connect with a personal access token.
## After connecting
Once a provider is linked, SAST opens up into five tabs across the top of the page, and a top-right **Report** button is available throughout. Until a provider is connected, SAST shows the onboarding screen above.
### Integrations
Your home base once connected. The top cards summarize your **Connections**, **Repositories**, **Findings**, and **Scans**, followed by a severity breakdown of all findings (Critical / High / Medium / Low) and how many are **fixable**.
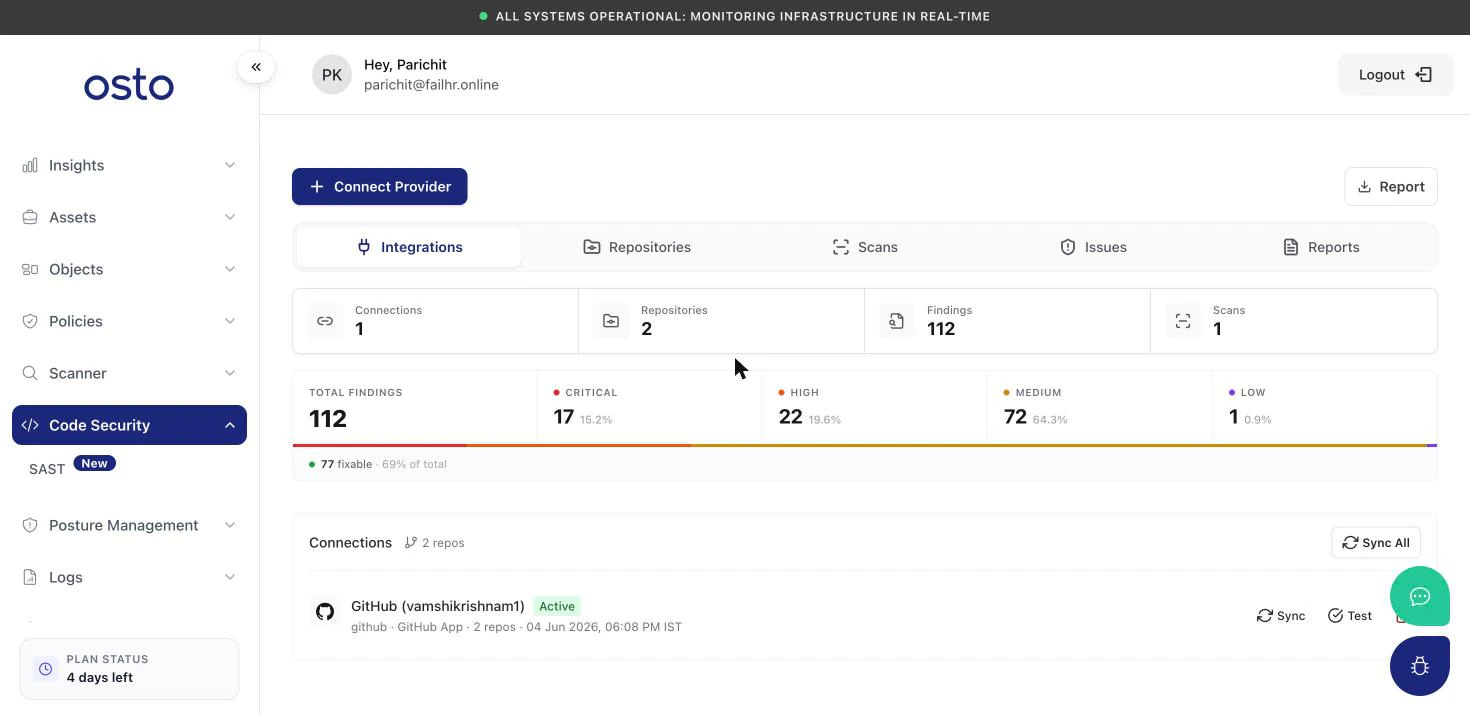 Below that, the **Connections** list shows each linked provider with its status, repository count, and last sync time. Use **Sync** to refresh a single connection (or **Sync All**) and **Test** to verify the connection still works.
### Repositories
Every repository Osto can see, with at-a-glance counts: total repositories, how many are inaccessible, the percentage scanned, how many auto-scan on push, how many have critical findings, and how many are clean. A **Top Languages** panel and a **Most Vulnerable** panel (ranked by Osto Risk Score) sit above the table.
Below that, the **Connections** list shows each linked provider with its status, repository count, and last sync time. Use **Sync** to refresh a single connection (or **Sync All**) and **Test** to verify the connection still works.
### Repositories
Every repository Osto can see, with at-a-glance counts: total repositories, how many are inaccessible, the percentage scanned, how many auto-scan on push, how many have critical findings, and how many are clean. A **Top Languages** panel and a **Most Vulnerable** panel (ranked by Osto Risk Score) sit above the table.
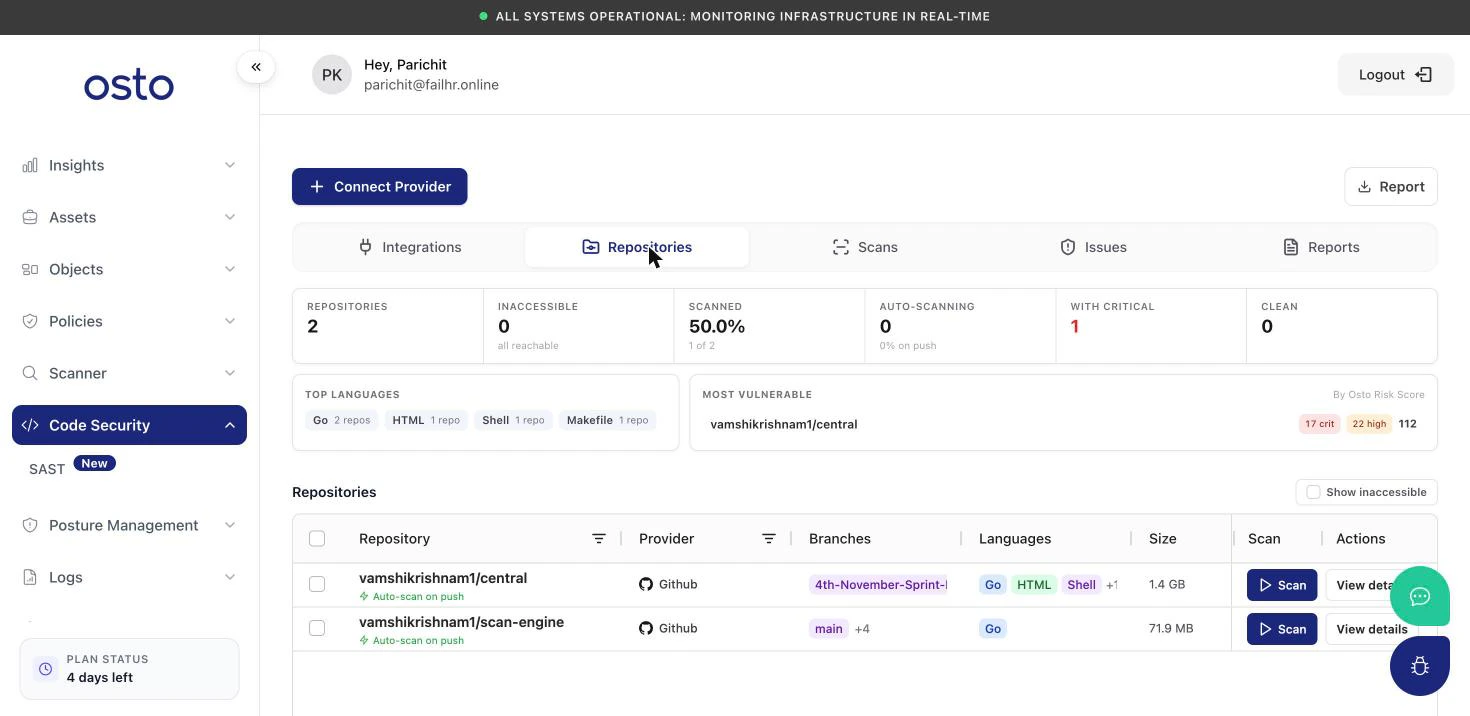 Each row lists the repository (with an **Auto-scan on push** indicator when enabled), provider, branches, languages, and size. Use the per-row **Scan** button to run a scan on demand, or **View details** to drill in.
### Scans
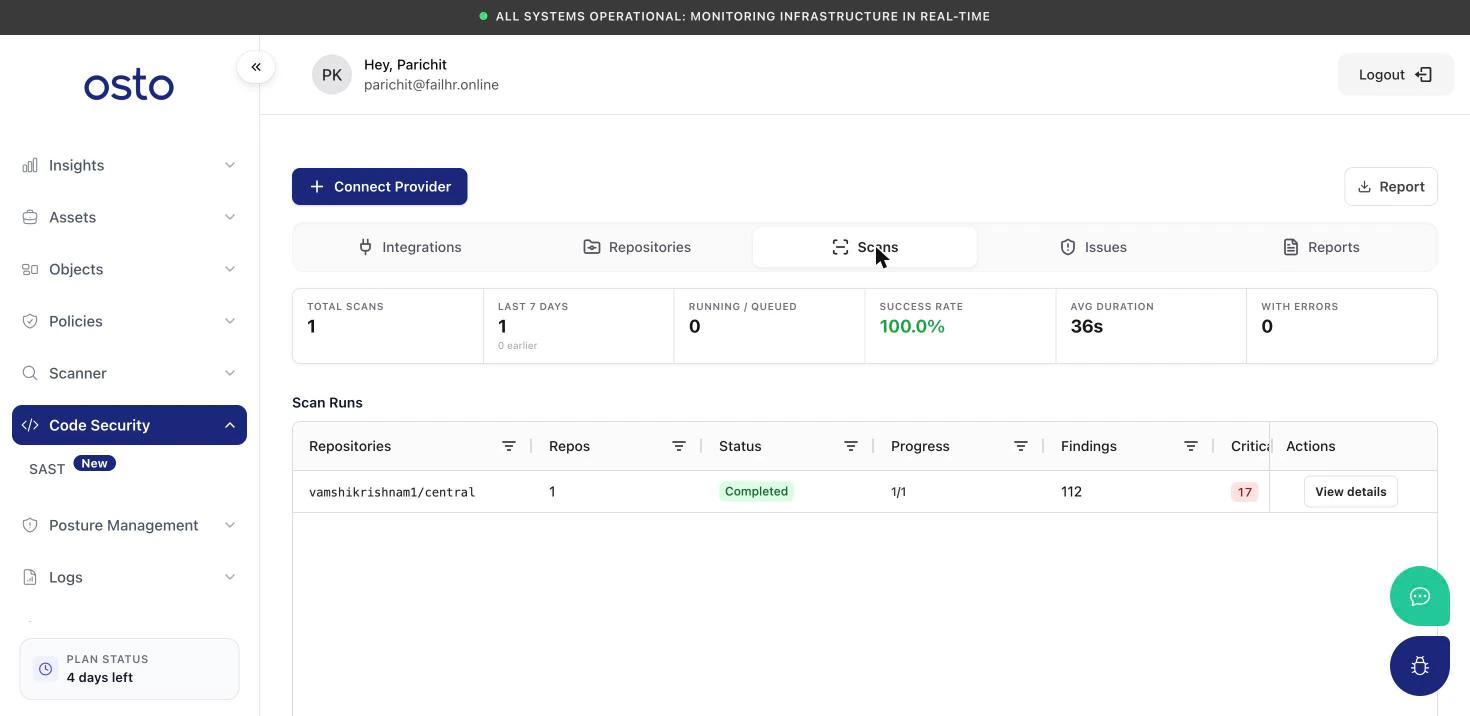
A record of every scan run. The summary cards cover total scans, scans in the last 7 days, anything running or queued, your success rate, average duration, and any runs with errors. The **Scan Runs** table lists each run with its repository, status, progress, total findings, and critical count.
Each row lists the repository (with an **Auto-scan on push** indicator when enabled), provider, branches, languages, and size. Use the per-row **Scan** button to run a scan on demand, or **View details** to drill in.
### Scans
A record of every scan run. The summary cards cover total scans, scans in the last 7 days, anything running or queued, your success rate, average duration, and any runs with errors. The **Scan Runs** table lists each run with its repository, status, progress, total findings, and critical count.
 ### Issues
The heart of SAST — every finding across your code. Summary cards show the **Total**, **Critical**, **High**, **KEV** (known-exploited), **Fixable**, and **Open** counts, alongside **Top Rules** (most-triggered rules) and **Top Files** (the hottest spots in your code).
### Issues
The heart of SAST — every finding across your code. Summary cards show the **Total**, **Critical**, **High**, **KEV** (known-exploited), **Fixable**, and **Open** counts, alongside **Top Rules** (most-triggered rules) and **Top Files** (the hottest spots in your code).
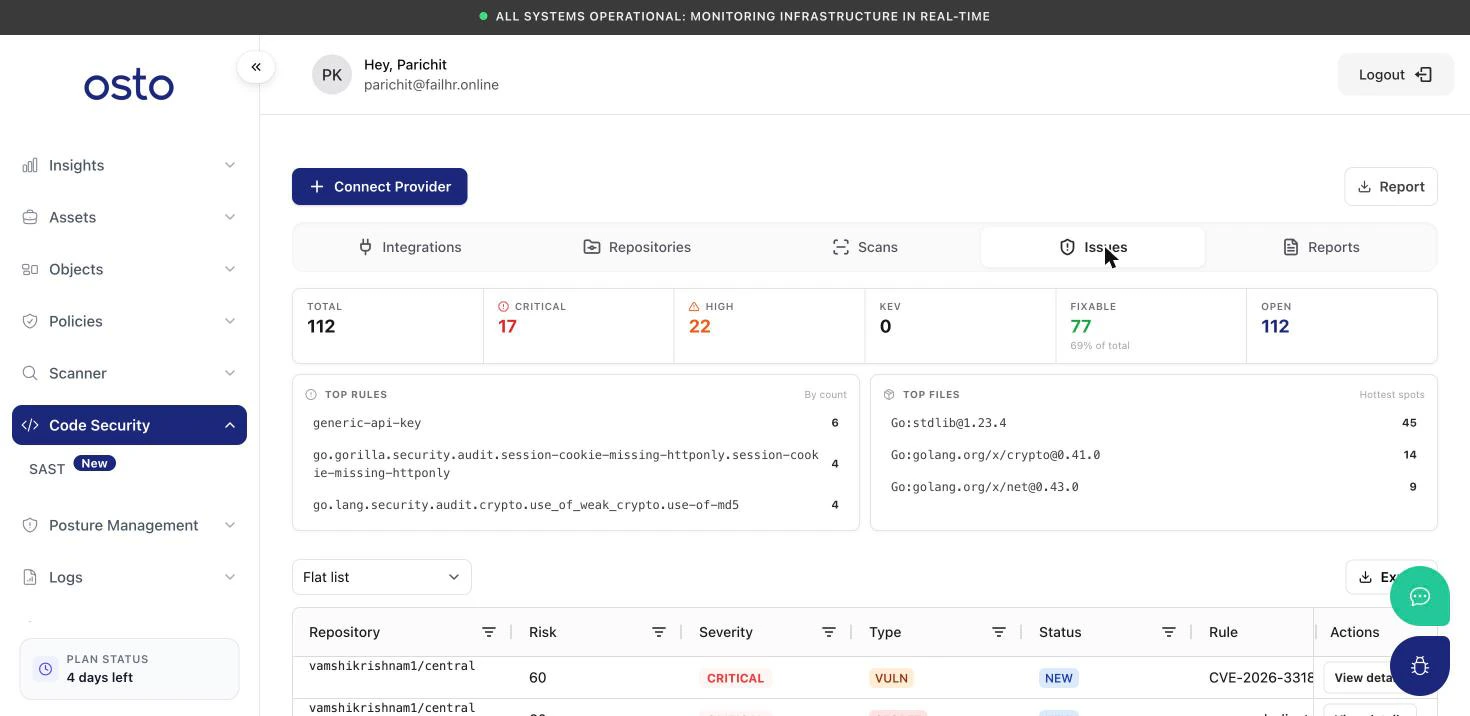 The findings table can be grouped (flat list, or by file, component, severity, type, or rule) and exported. Each finding shows its repository, risk score, severity, **type** — **VULN** (vulnerable dependency), **SECRET** (exposed credential), or **SAST** (code-analysis issue) — status, and the rule and message.
Select **View details** on any finding to open the **Finding Detail** panel:
The findings table can be grouped (flat list, or by file, component, severity, type, or rule) and exported. Each finding shows its repository, risk score, severity, **type** — **VULN** (vulnerable dependency), **SECRET** (exposed credential), or **SAST** (code-analysis issue) — status, and the rule and message.
Select **View details** on any finding to open the **Finding Detail** panel:
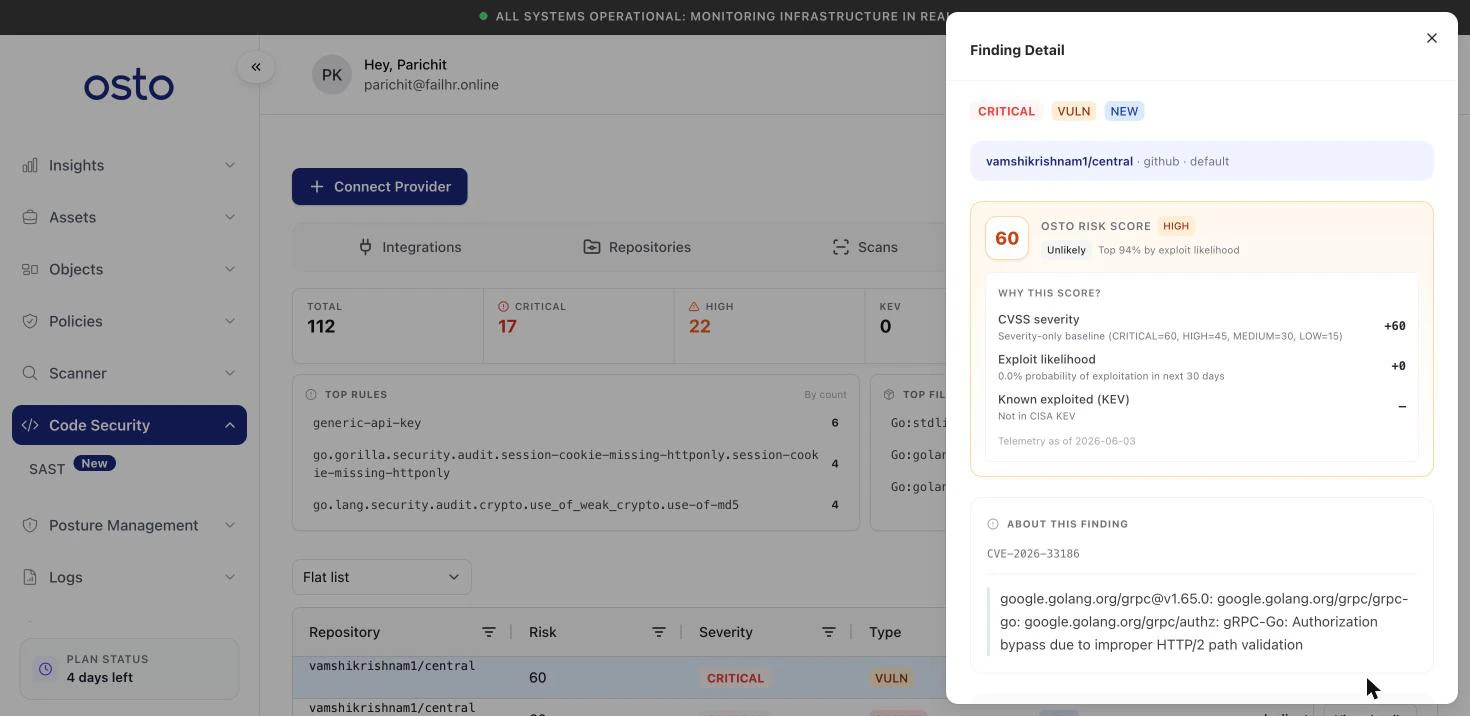 It explains the **Osto Risk Score** — how CVSS severity, exploit likelihood, and known-exploited (KEV) status combine — describes the finding (with its CVE where relevant), and pinpoints the affected **file**, **component**, recommended **fix version**, and **CWE**. From the **Triage** section you can **mark a finding as triaged** to mute it (and its matches across branches and repos) when it's a false positive, accepted risk, or a test-only path.
### Reports
Export your current results on demand. The **Download now** section offers two exports:
| Export | What you get |
| -------------------- | ------------------------------------------------------------------------------------------ |
| **Executive report** | An org-wide HTML overview — severity distribution, top vulnerable repos, and recent scans. |
| **Findings CSV** | The full findings list as a compliance-friendly CSV (up to 10,000 rows). |
It explains the **Osto Risk Score** — how CVSS severity, exploit likelihood, and known-exploited (KEV) status combine — describes the finding (with its CVE where relevant), and pinpoints the affected **file**, **component**, recommended **fix version**, and **CWE**. From the **Triage** section you can **mark a finding as triaged** to mute it (and its matches across branches and repos) when it's a false positive, accepted risk, or a test-only path.
### Reports
Export your current results on demand. The **Download now** section offers two exports:
| Export | What you get |
| -------------------- | ------------------------------------------------------------------------------------------ |
| **Executive report** | An org-wide HTML overview — severity distribution, top vulnerable repos, and recent scans. |
| **Findings CSV** | The full findings list as a compliance-friendly CSV (up to 10,000 rows). |
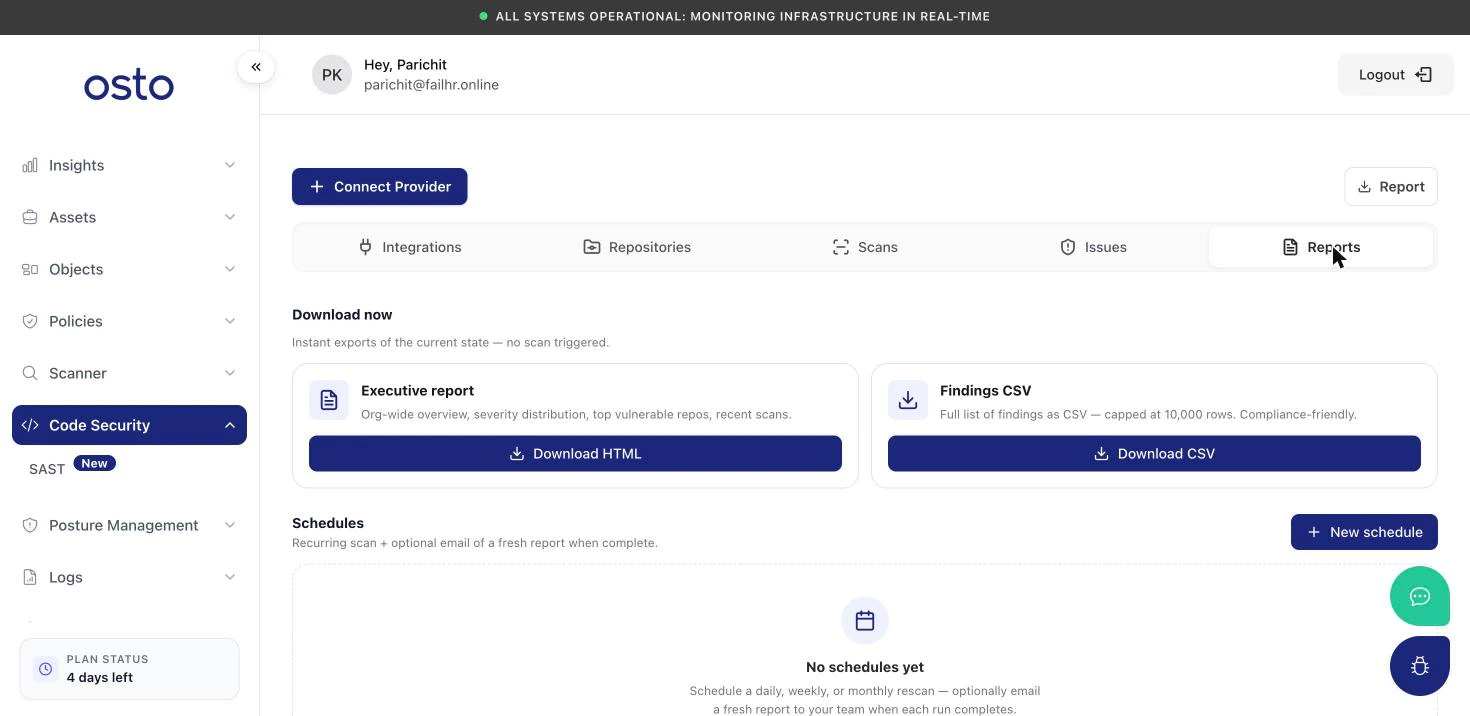 Downloading a report under **Download now** exports the current state — it doesn't trigger a new scan.
## Schedules
Below the on-demand exports, the **Schedules** area lets you automate recurring scans and have a fresh report emailed to your team when each run completes. With no schedules set up it shows *"No schedules yet."* Click **New schedule** to open the schedule builder.
Downloading a report under **Download now** exports the current state — it doesn't trigger a new scan.
## Schedules
Below the on-demand exports, the **Schedules** area lets you automate recurring scans and have a fresh report emailed to your team when each run completes. With no schedules set up it shows *"No schedules yet."* Click **New schedule** to open the schedule builder.
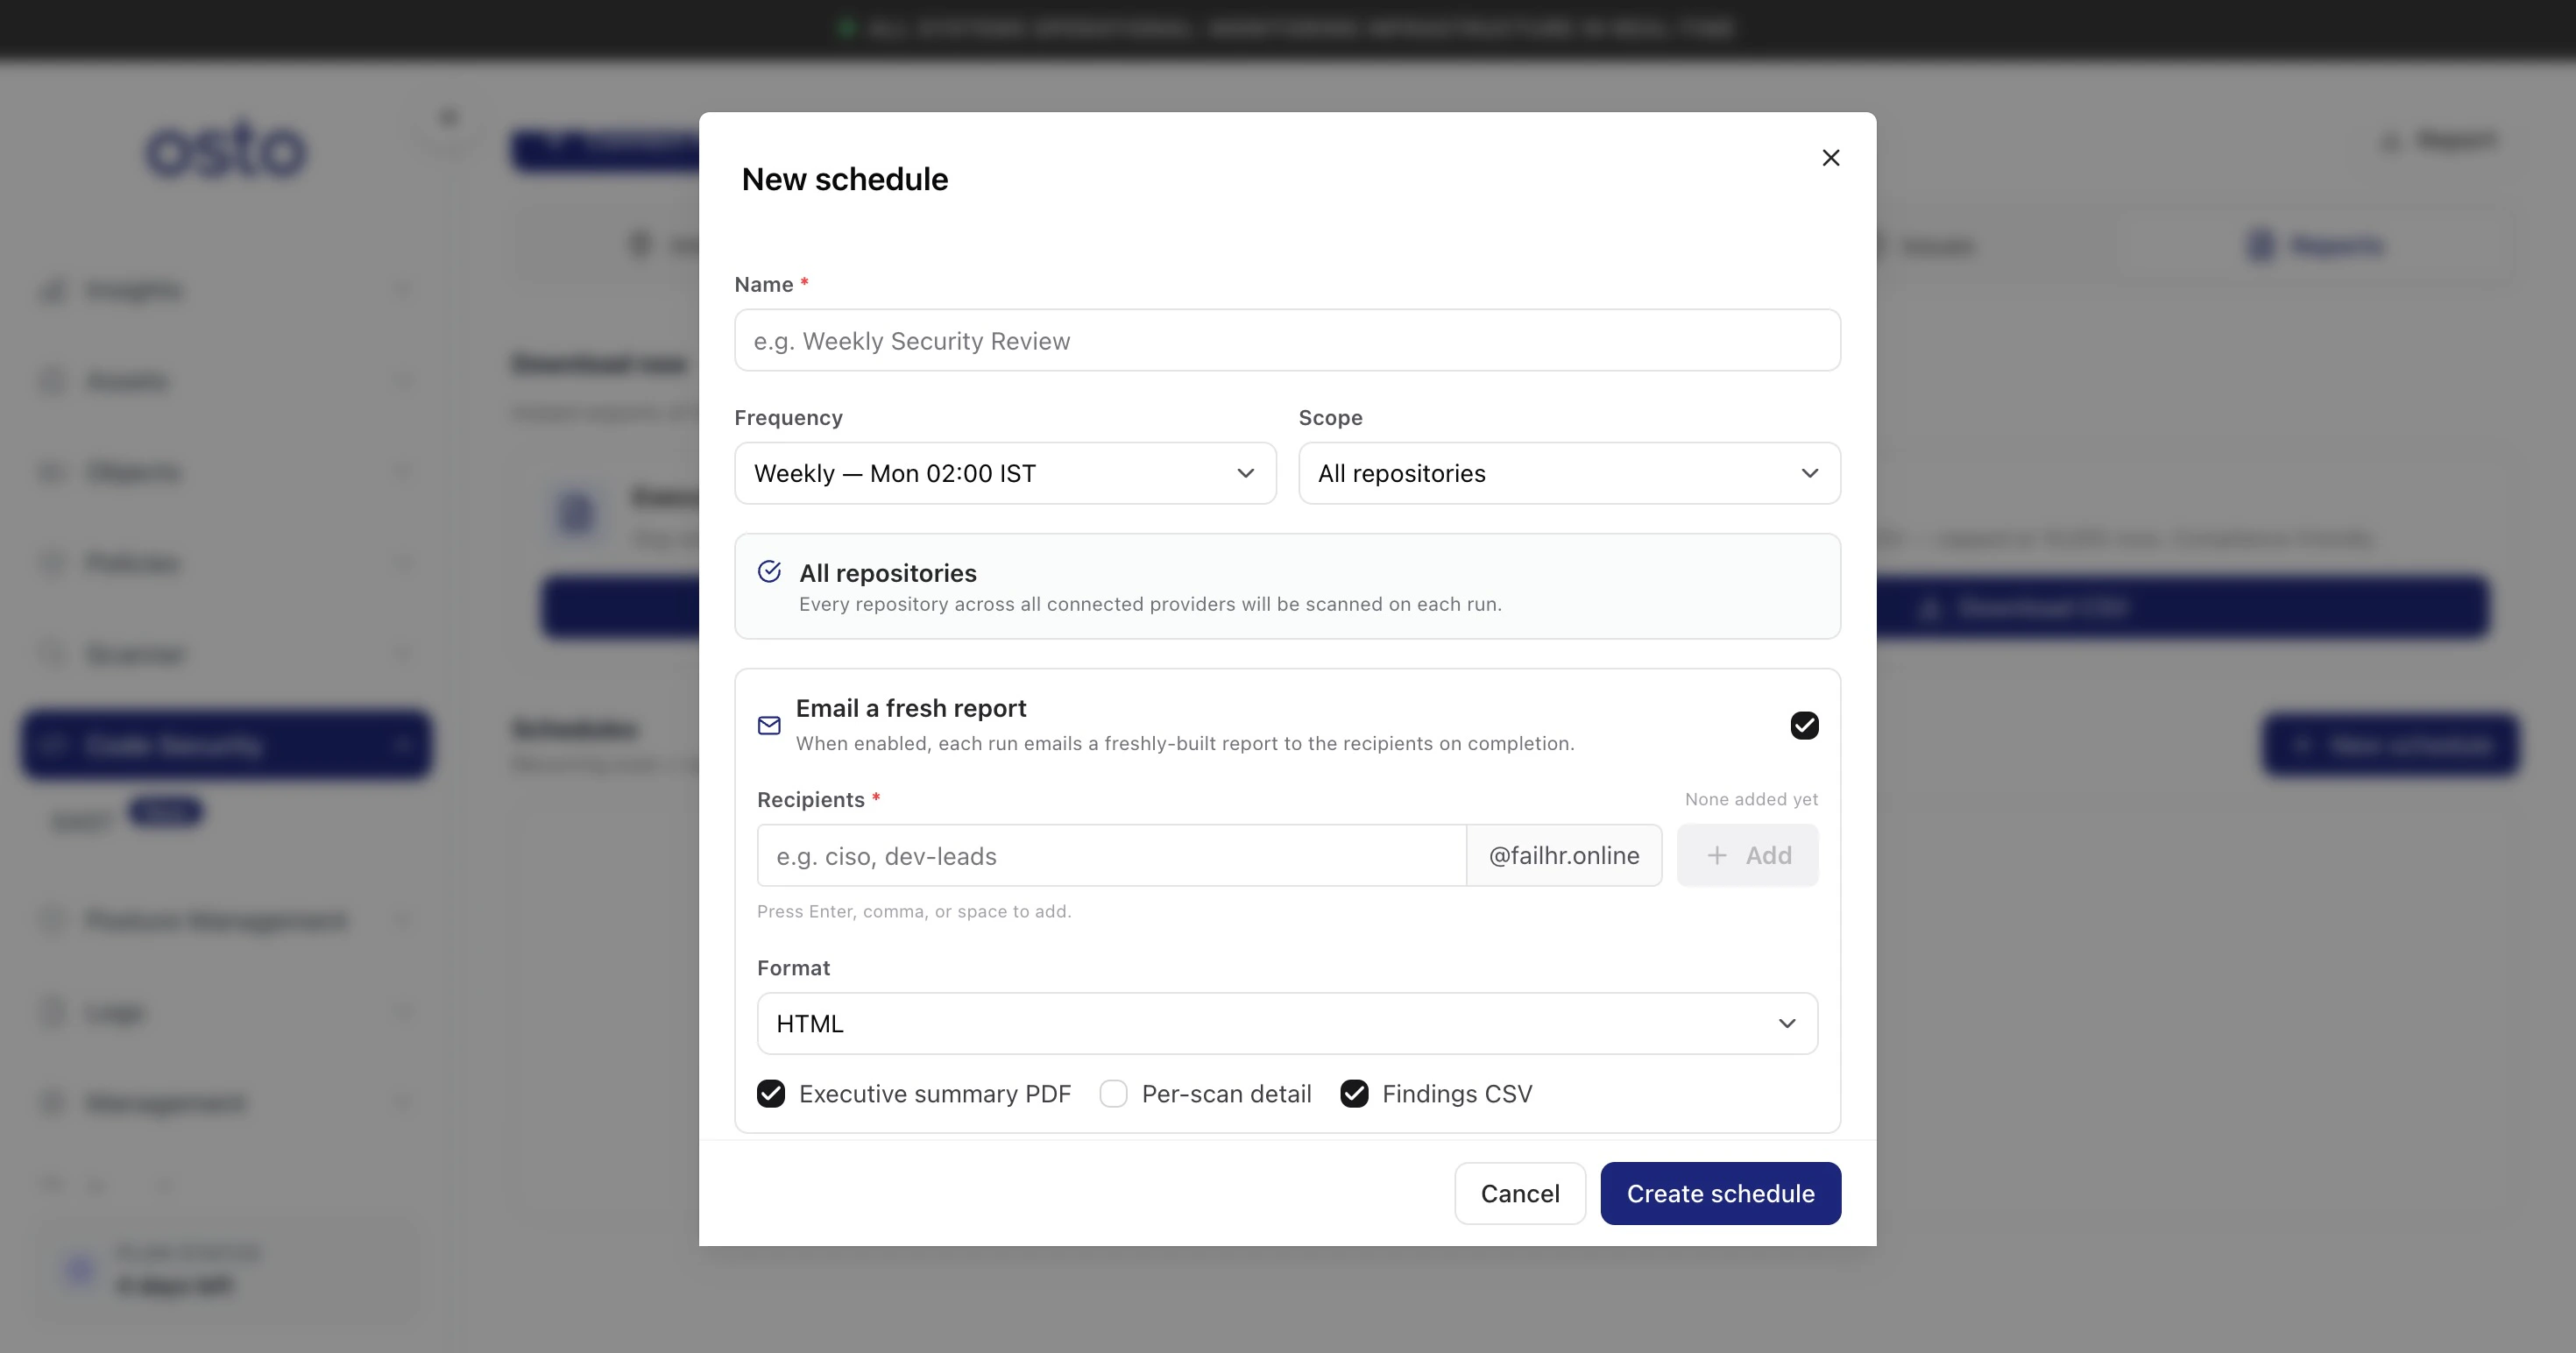 The dialog has these options:
| Field | Options / notes |
| ----------------------------------------- | ------------------------------------------------------------------------------------------------------------------------ |
| **Name** *(required)* | A label for the schedule (e.g. "Weekly Security Review"). |
| **Frequency** | **Daily** (02:00 IST), **Weekly** (Mon 02:00 IST), or **Monthly** (1st, 02:00 IST). |
| **Scope** | **All repositories** (everything across all connected providers), a **single connection**, or **multiple repositories**. |
| **Email a fresh report** | A toggle (on by default). When enabled, each completed run emails a freshly built report to the recipients below. |
| **Recipients** *(required when emailing)* | Add one or more recipients — press Enter, comma, or space to add each. |
| **Format** | **HTML**, **PDF**, or **CSV**. |
| **Report contents** | Choose what the email includes: **Executive summary PDF**, **Per-scan detail**, and/or **Findings CSV**. |
Fill in the fields and select **Create schedule**. Each run then scans the chosen scope on the set cadence and — if email is enabled — delivers the report automatically.
The dialog has these options:
| Field | Options / notes |
| ----------------------------------------- | ------------------------------------------------------------------------------------------------------------------------ |
| **Name** *(required)* | A label for the schedule (e.g. "Weekly Security Review"). |
| **Frequency** | **Daily** (02:00 IST), **Weekly** (Mon 02:00 IST), or **Monthly** (1st, 02:00 IST). |
| **Scope** | **All repositories** (everything across all connected providers), a **single connection**, or **multiple repositories**. |
| **Email a fresh report** | A toggle (on by default). When enabled, each completed run emails a freshly built report to the recipients below. |
| **Recipients** *(required when emailing)* | Add one or more recipients — press Enter, comma, or space to add each. |
| **Format** | **HTML**, **PDF**, or **CSV**. |
| **Report contents** | Choose what the email includes: **Executive summary PDF**, **Per-scan detail**, and/or **Findings CSV**. |
Fill in the fields and select **Create schedule**. Each run then scans the chosen scope on the set cadence and — if email is enabled — delivers the report automatically.