> ## Documentation Index
> Fetch the complete documentation index at: https://docs.osto.one/llms.txt
> Use this file to discover all available pages before exploring further.
# Web App Logs
> A live record of traffic hitting your protected websites — detected threats, the full access log, and policy violations.
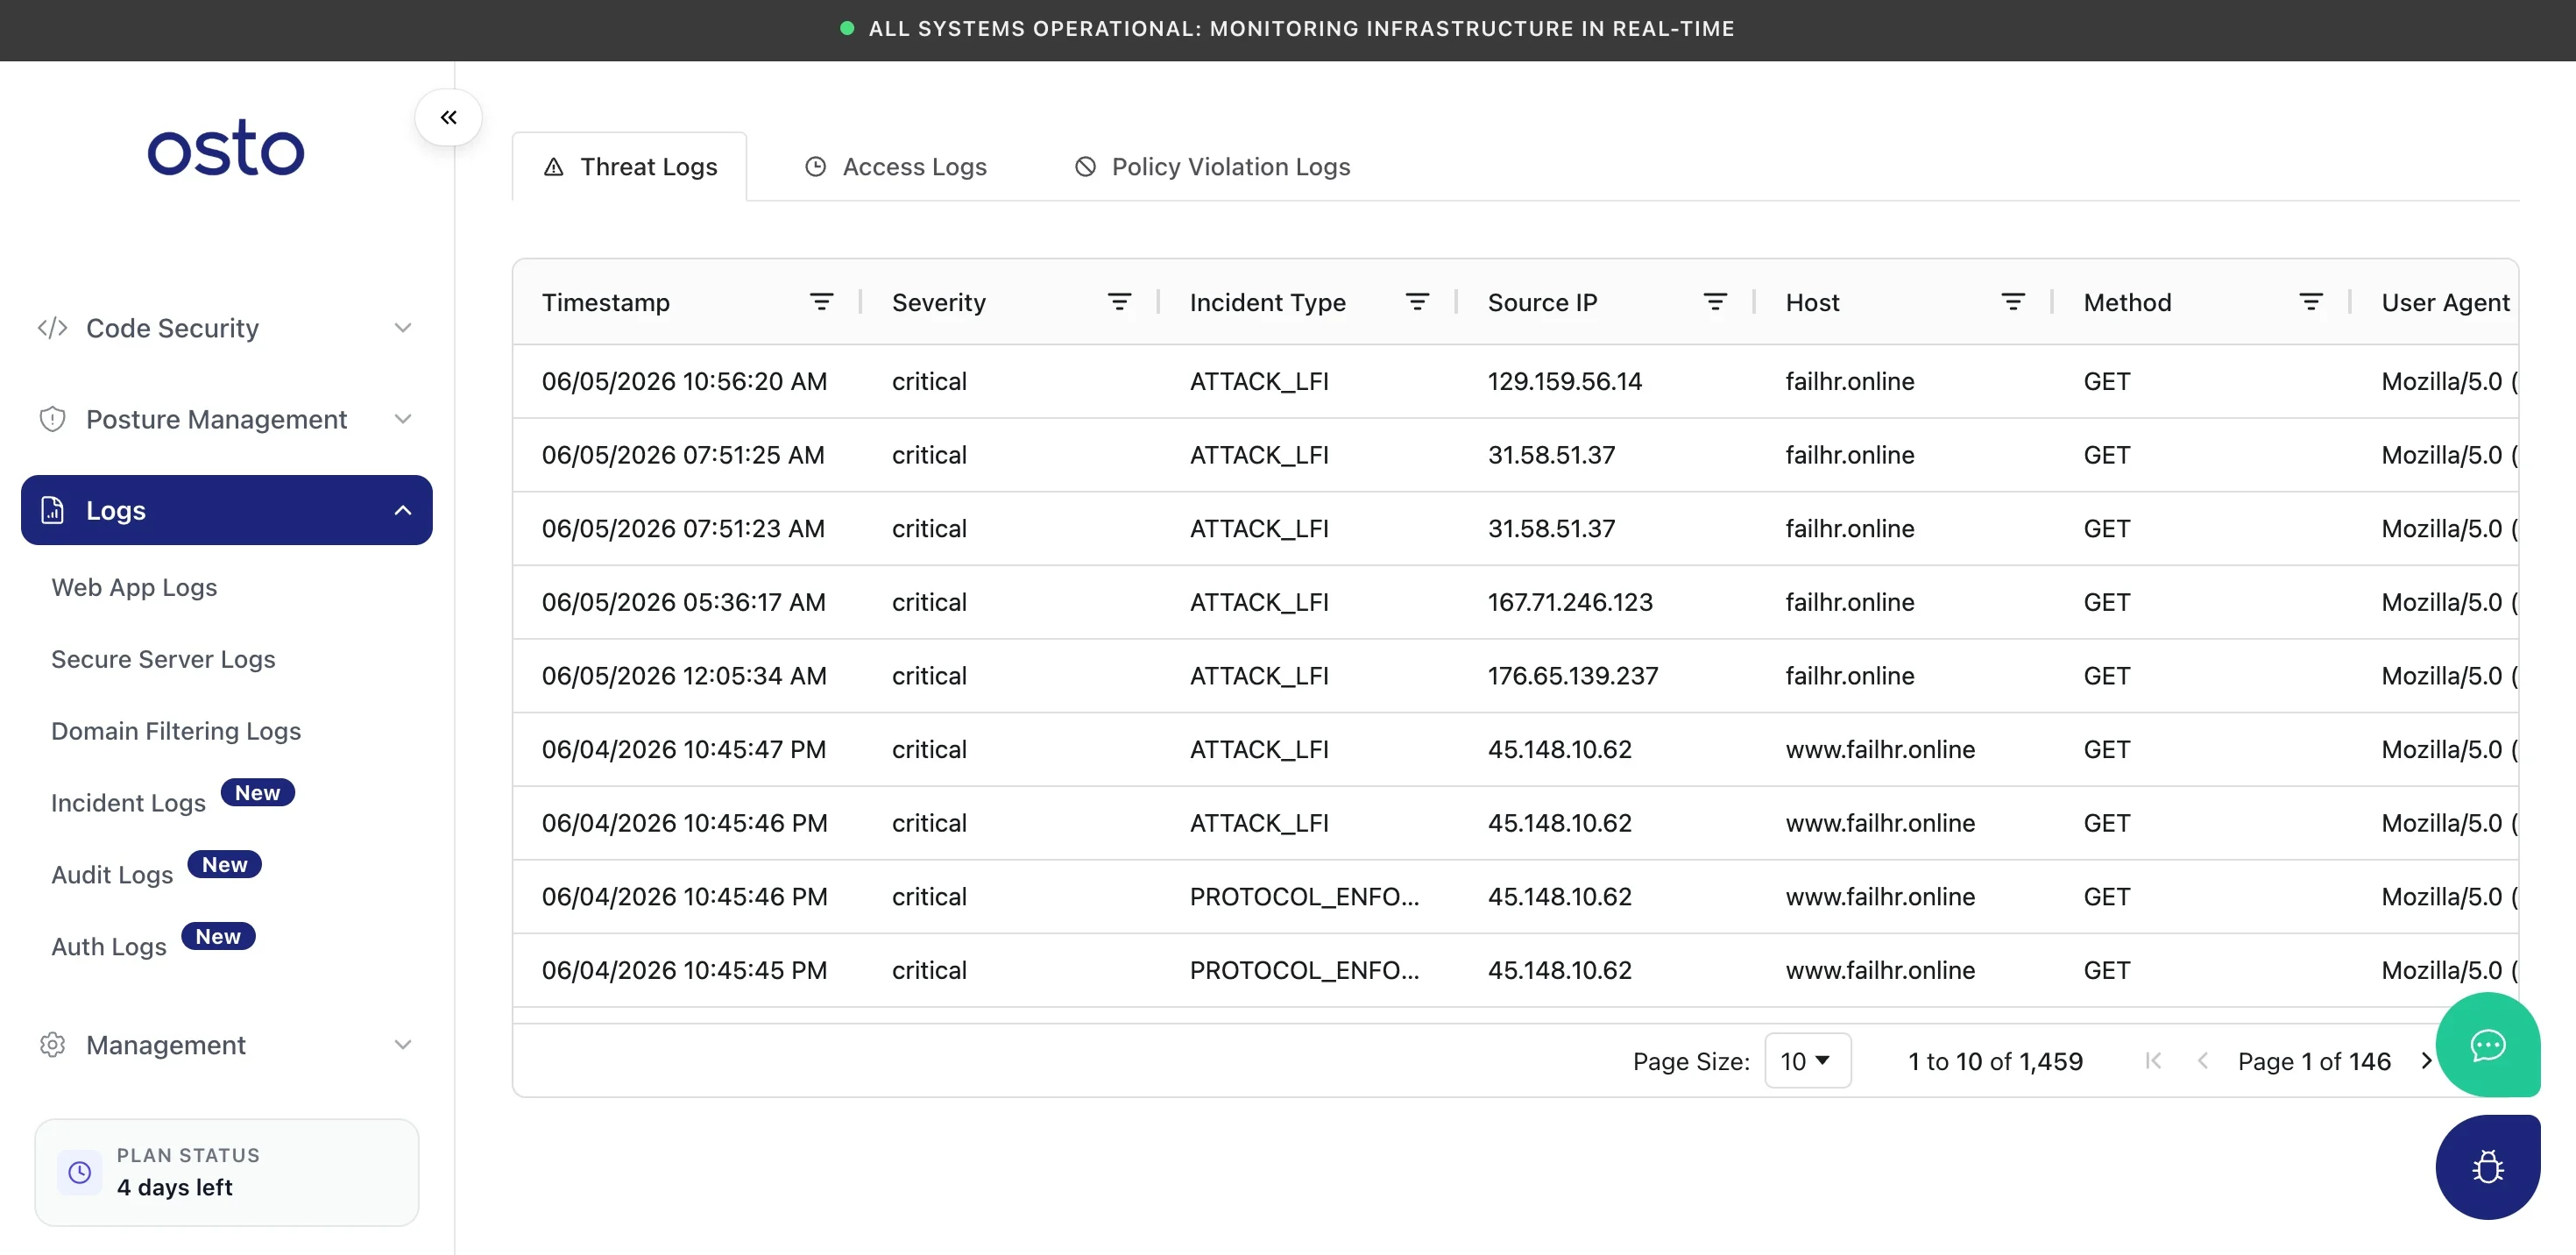
**Web App Logs** is the most active log view — a live record of traffic hitting your protected websites. It's organized into three tabs.
> **Path:** Logs → Web App Logs
 | Tab | Columns | What it shows |
| ------------------------- | ----------------------------------------------------------------------------------- | --------------------------------------------------- |
| **Threat Logs** | Timestamp, Severity, Incident Type, Source IP, Host, Method, User Agent, Request ID | Every attack Osto detected and blocked. |
| **Access Logs** | Timestamp, Source IP, Host, Method, URI, Status Code, Protocol | The full request access log for your sites. |
| **Policy Violation Logs** | Timestamp, Severity, Incident Type, Source IP, Host, Method, User Agent | Requests that tripped one of your protection rules. |
Use the per-column filters to narrow by severity, host, source IP, or time, and the **Request ID** to correlate a threat entry with its underlying request.
| Tab | Columns | What it shows |
| ------------------------- | ----------------------------------------------------------------------------------- | --------------------------------------------------- |
| **Threat Logs** | Timestamp, Severity, Incident Type, Source IP, Host, Method, User Agent, Request ID | Every attack Osto detected and blocked. |
| **Access Logs** | Timestamp, Source IP, Host, Method, URI, Status Code, Protocol | The full request access log for your sites. |
| **Policy Violation Logs** | Timestamp, Severity, Incident Type, Source IP, Host, Method, User Agent | Requests that tripped one of your protection rules. |
Use the per-column filters to narrow by severity, host, source IP, or time, and the **Request ID** to correlate a threat entry with its underlying request.