

Path: Code Security → SAST
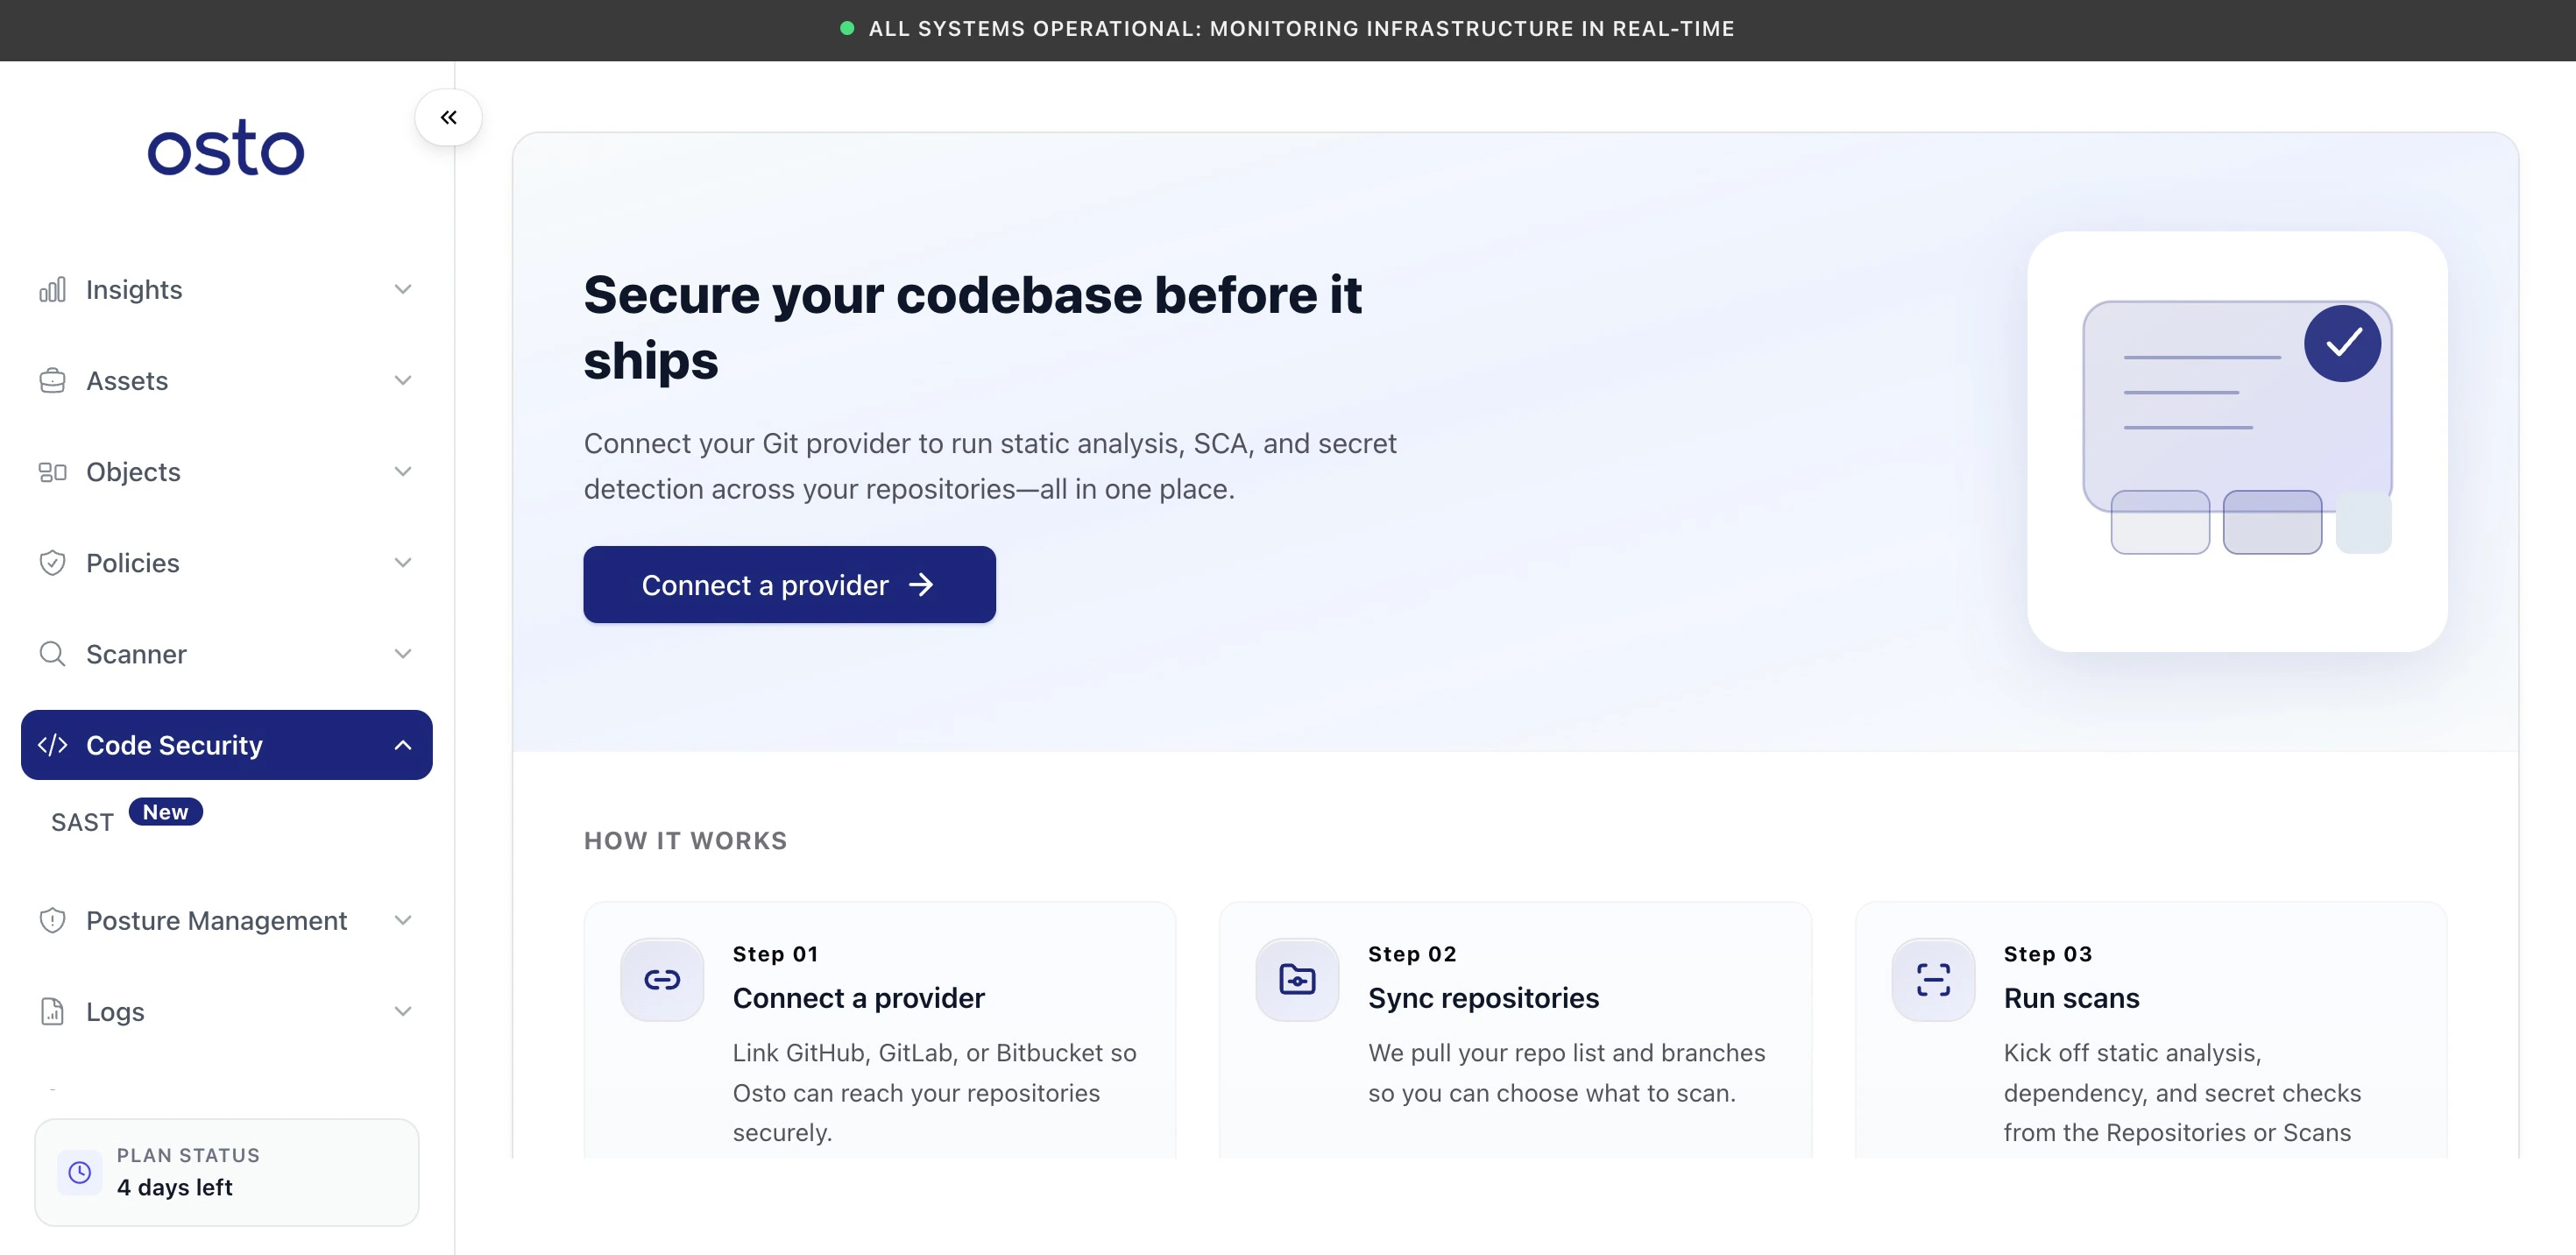
The SAST onboarding screen — connect a Git provider to get started.
How it works
Getting started takes three steps:Connect a provider
Click Connect a provider to open the connection dialog, then choose your Git host:GitHub
Connect with a GitHub App or a personal access token.
GitLab
Connect gitlab.com or a self-hosted instance via OAuth or a token.
Bitbucket
Connect with OAuth or an app password.
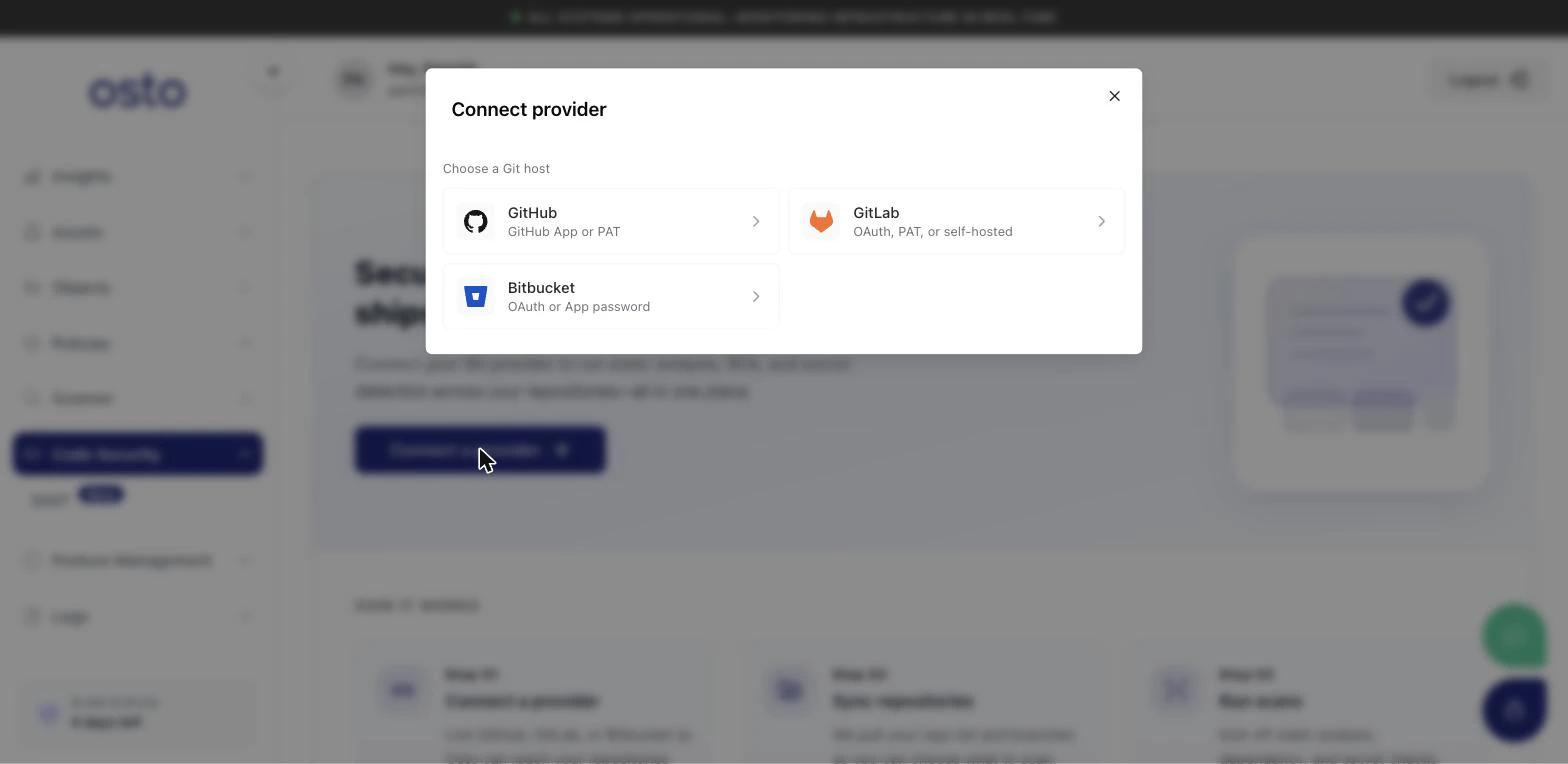
Choose a Git host — GitHub, GitLab, or Bitbucket.
Choose how to connect
After picking a host, choose a connection method: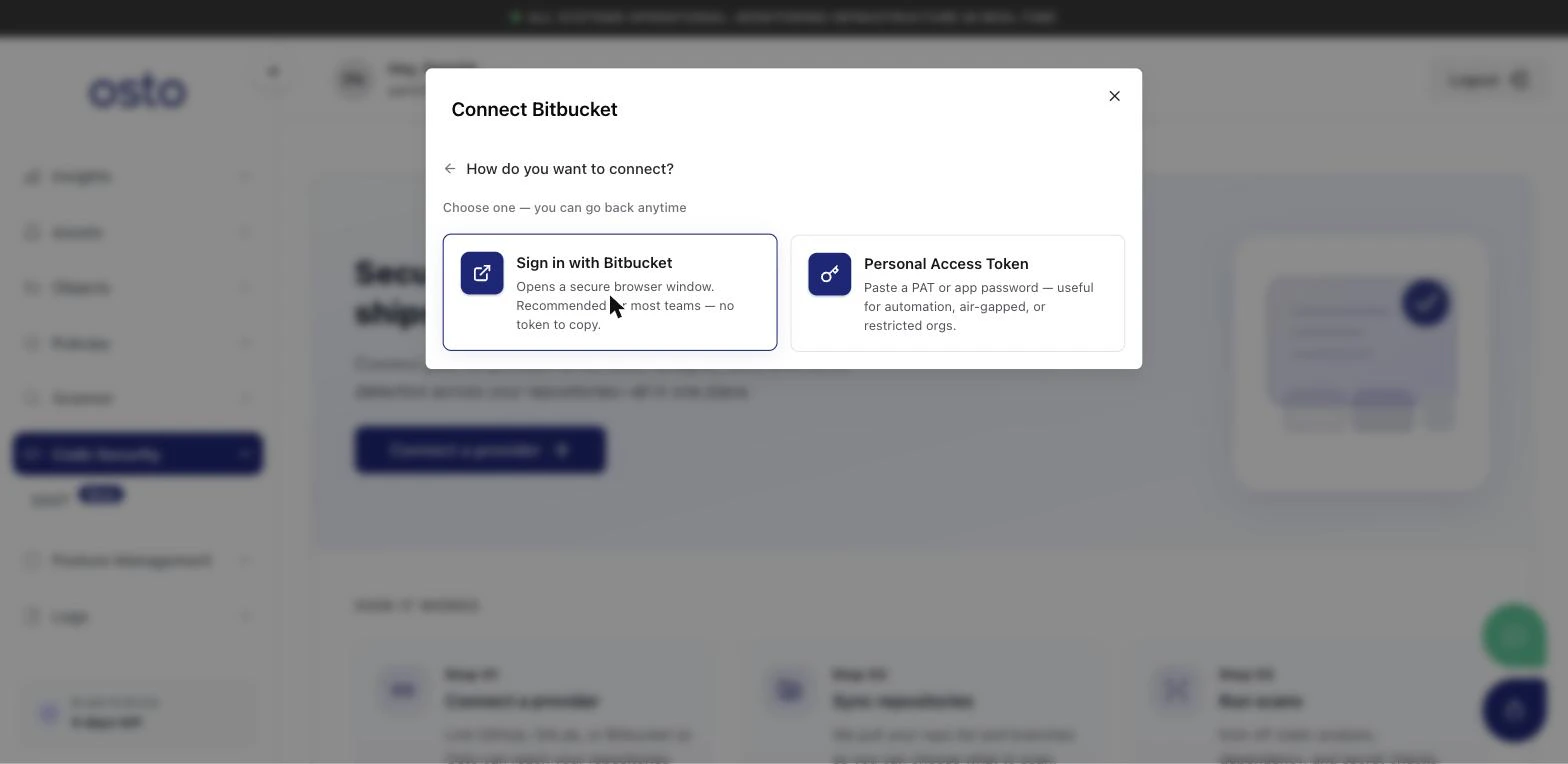
Each provider supports a guided sign-in or a personal access token.
- Sign in with the provider — opens a secure browser window to authorize Osto. Recommended for most teams; there’s no token to copy.
- Personal Access Token — paste a token or app password. Useful for automation, air-gapped environments, or restricted organizations. You’ll give the connection a name and paste the token, then select Add connection.
Connecting GitLab adds one extra choice: gitlab.com (cloud) or a self-hosted GitLab instance (your own CE/EE URL). Self-hosted instances connect with a personal access token.
After connecting
Once a provider is linked, SAST opens up into five tabs across the top of the page, and a top-right Report button is available throughout. Until a provider is connected, SAST shows the onboarding screen above.Integrations
Your home base once connected. The top cards summarize your Connections, Repositories, Findings, and Scans, followed by a severity breakdown of all findings (Critical / High / Medium / Low) and how many are fixable.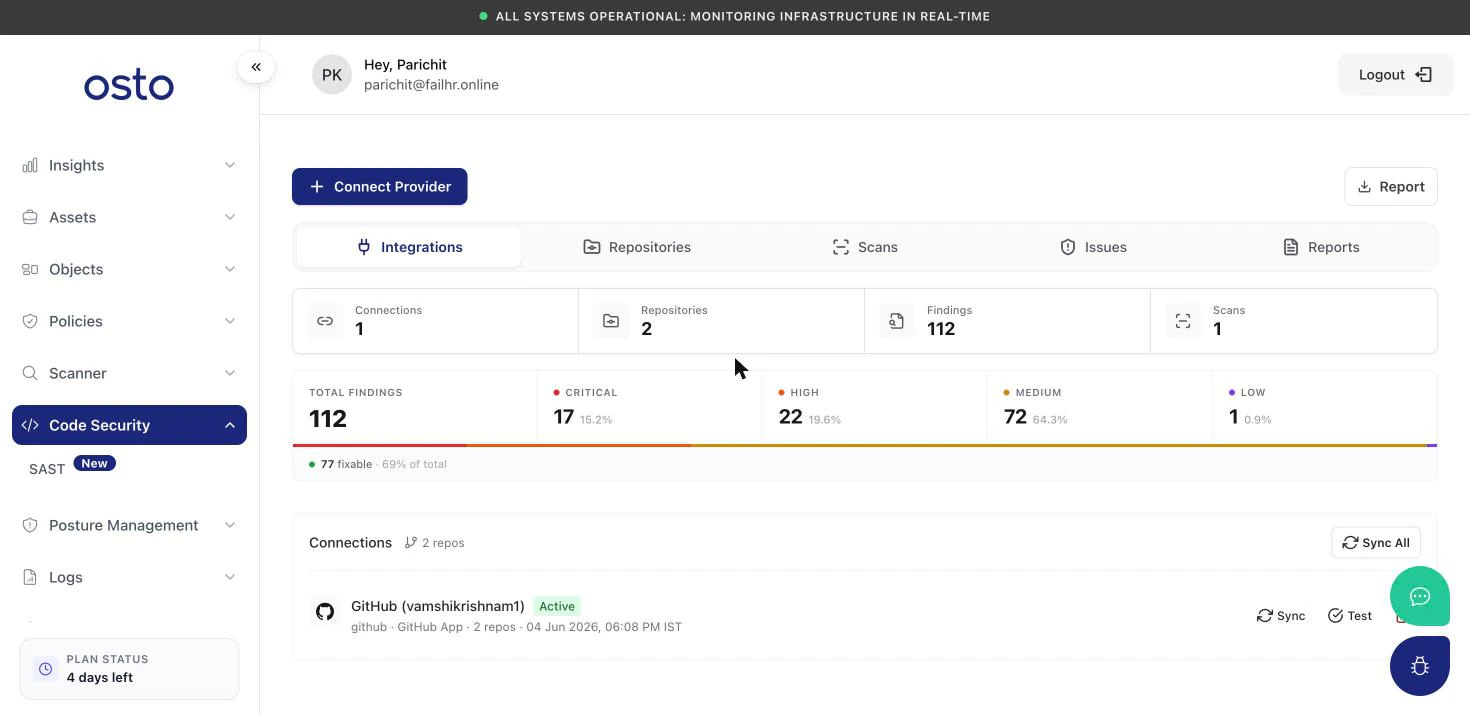
The Integrations tab after connecting — counts, severity breakdown, and your provider connections.
Repositories
Every repository Osto can see, with at-a-glance counts: total repositories, how many are inaccessible, the percentage scanned, how many auto-scan on push, how many have critical findings, and how many are clean. A Top Languages panel and a Most Vulnerable panel (ranked by Osto Risk Score) sit above the table.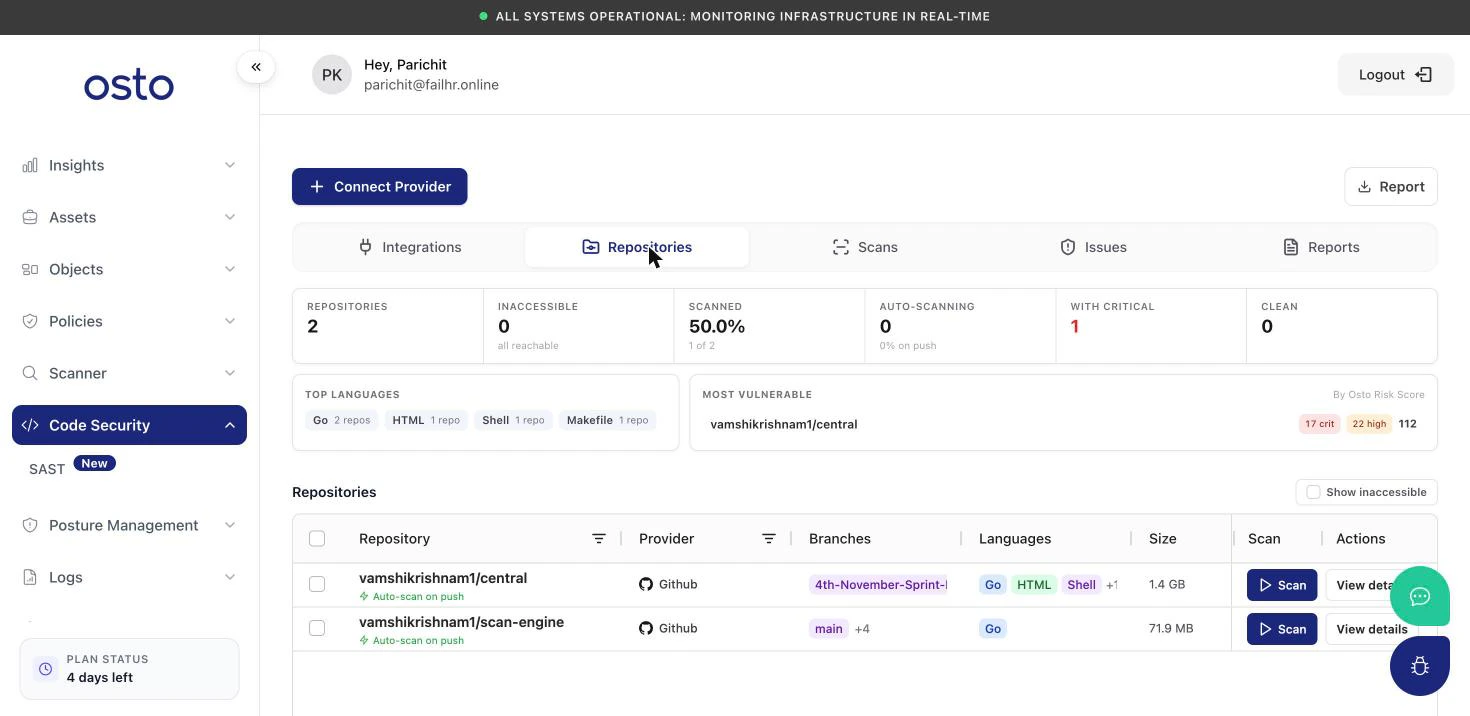
The Repositories tab — coverage stats and a per-repository table.
Scans
A record of every scan run. The summary cards cover total scans, scans in the last 7 days, anything running or queued, your success rate, average duration, and any runs with errors. The Scan Runs table lists each run with its repository, status, progress, total findings, and critical count.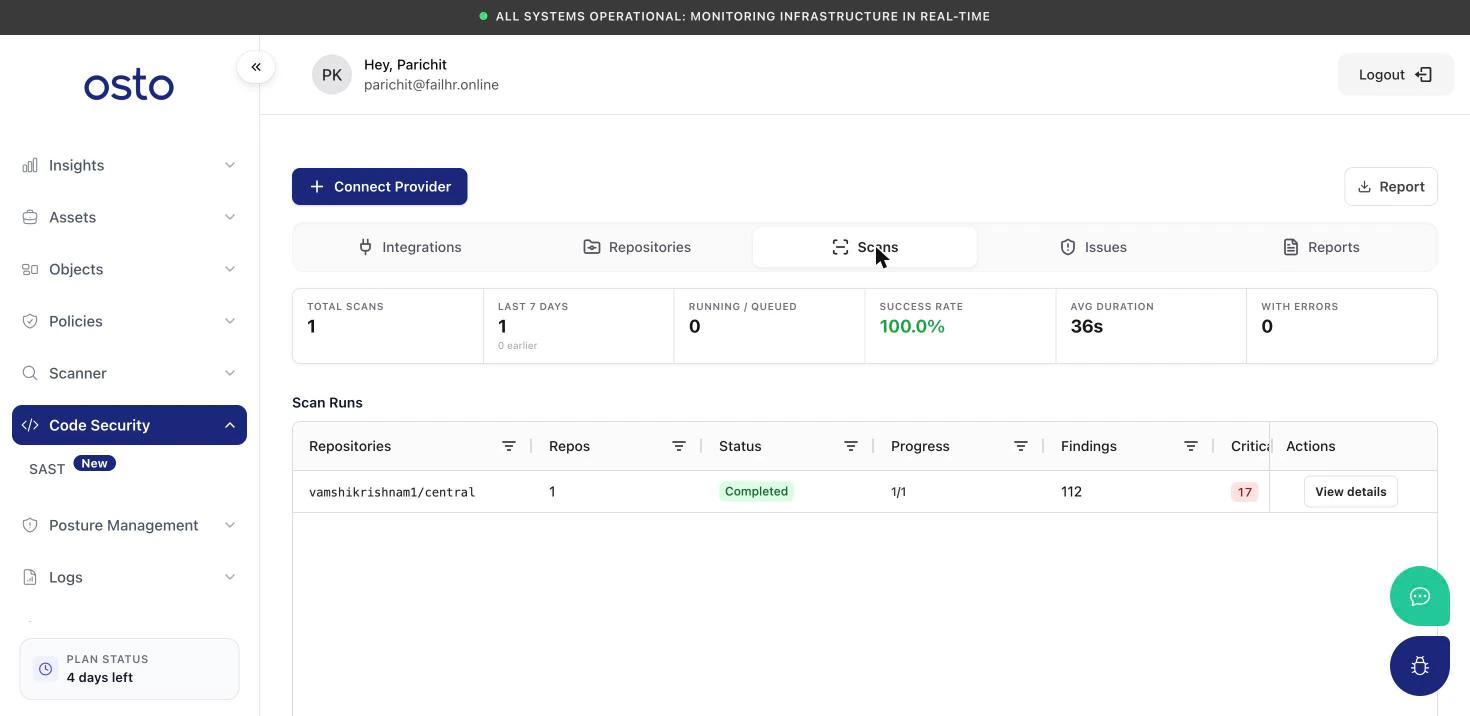
The Scans tab — run statistics and a log of every scan.
Issues
The heart of SAST — every finding across your code. Summary cards show the Total, Critical, High, KEV (known-exploited), Fixable, and Open counts, alongside Top Rules (most-triggered rules) and Top Files (the hottest spots in your code).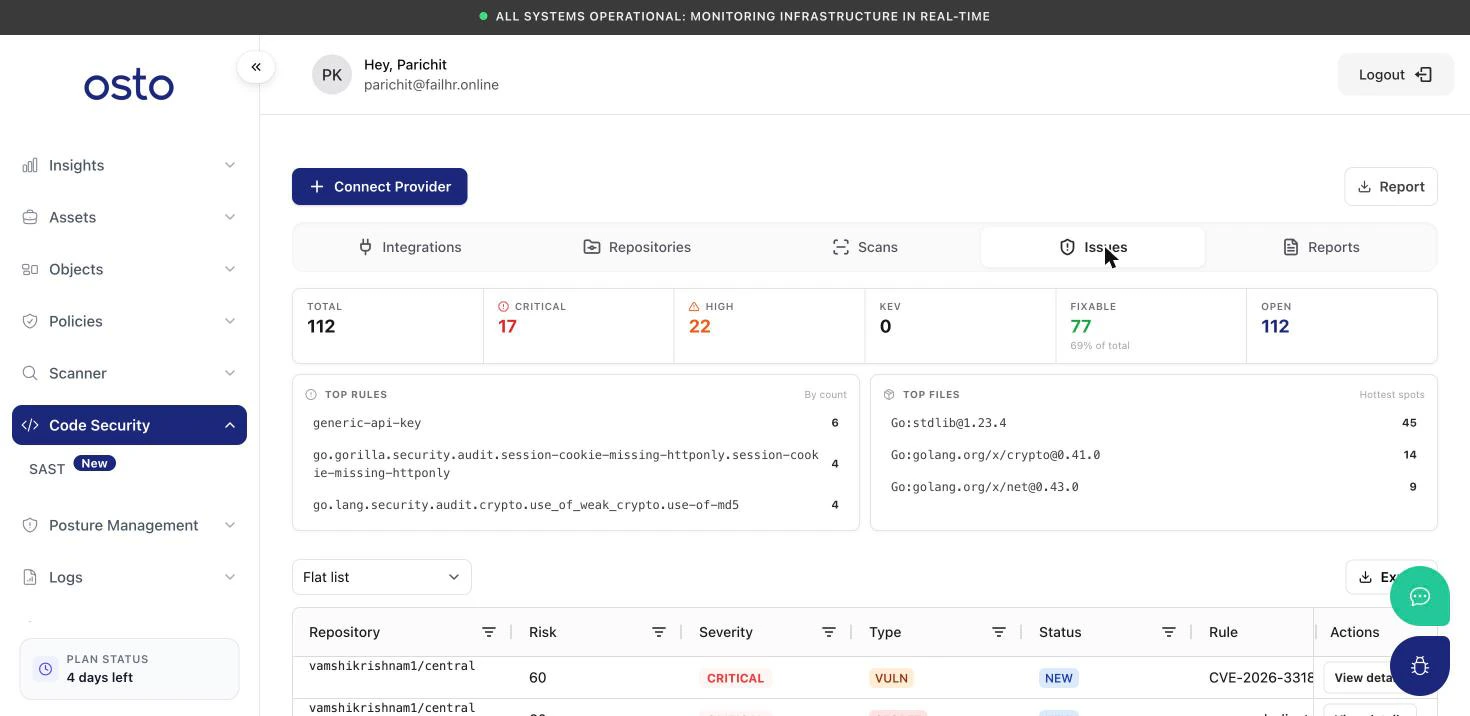
The Issues tab — findings with severity, type, and the rule that flagged them.
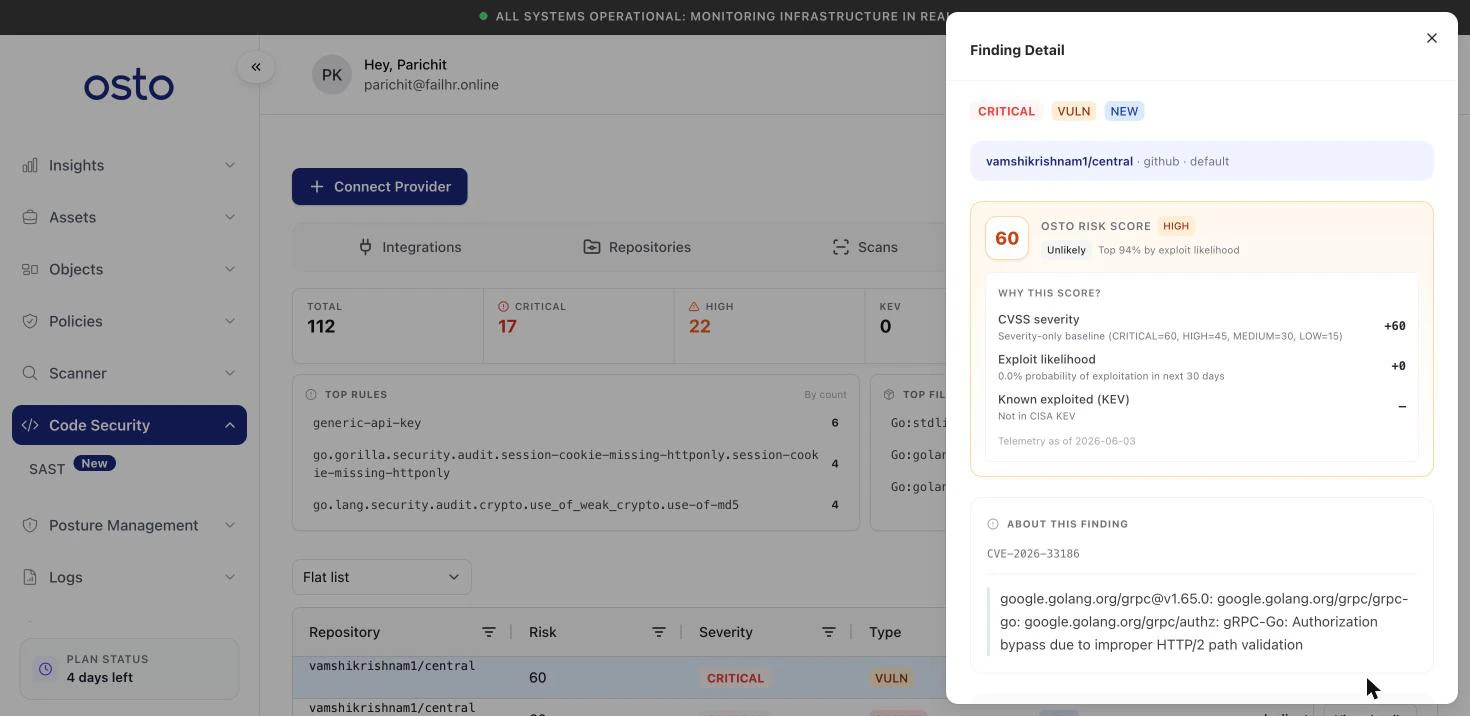
Finding Detail — risk scoring, the affected component, the fix, and triage controls.
Reports
Export your current results on demand. The Download now section offers two exports: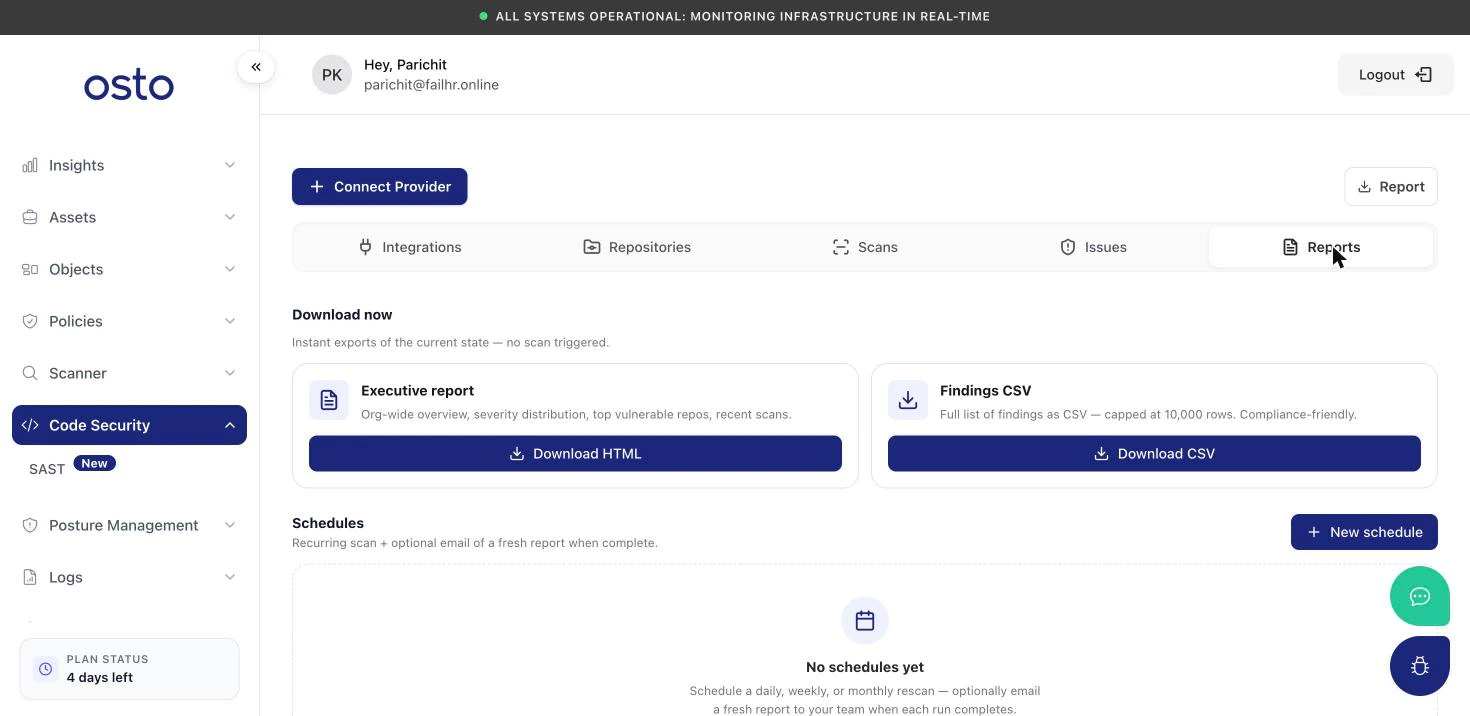
The Reports tab — on-demand exports plus a Schedules area for recurring reports.
Downloading a report under Download now exports the current state — it doesn’t trigger a new scan.
Schedules
Below the on-demand exports, the Schedules area lets you automate recurring scans and have a fresh report emailed to your team when each run completes. With no schedules set up it shows “No schedules yet.” Click New schedule to open the schedule builder.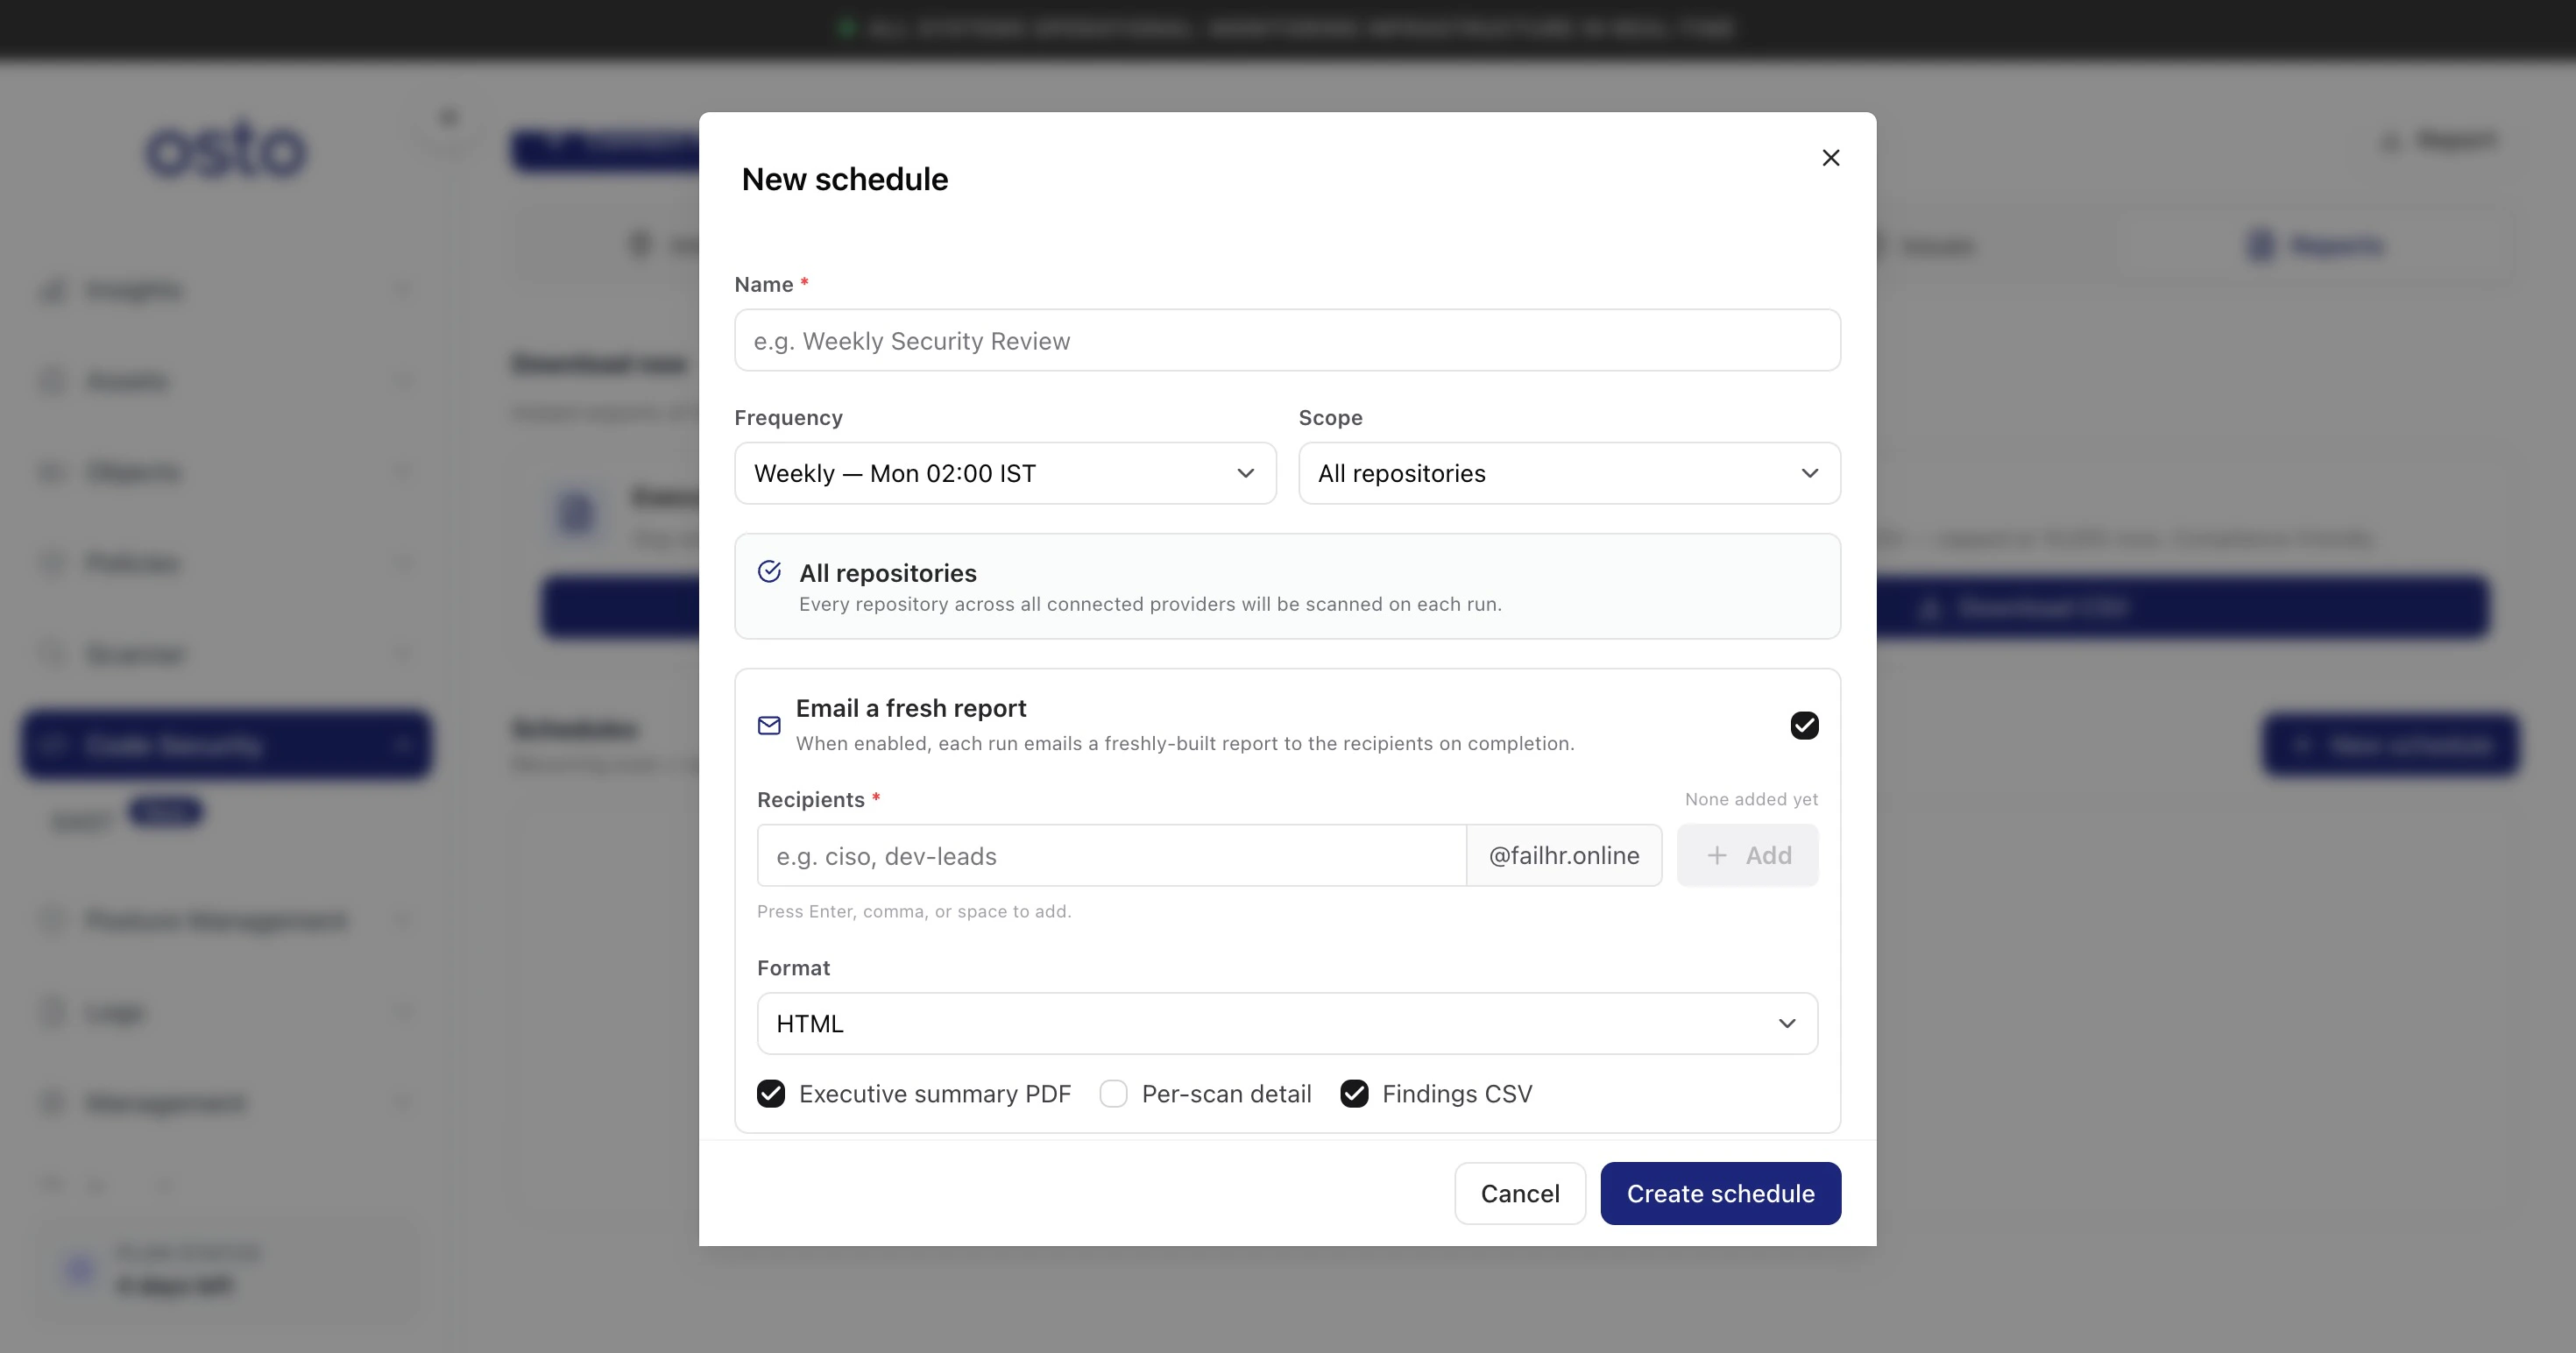
The New schedule dialog — frequency, scope, and optional emailed report.
Fill in the fields and select Create schedule. Each run then scans the chosen scope on the set cadence and — if email is enabled — delivers the report automatically.